The Investment Case for Gold Stocks
Gold's unique investment dynamics and why an allocation to gold stocks makes sense
This Insight is not investment advice and should not be construed as such. Past performance is not predictive of future results. Fund(s) managed by Seraya Investment may be long or short securities mentioned in this Insight. Any resemblance of people or companies mentioned in this Insight to real entities is purely coincidental. Our full Disclaimer can be found here.
This Insight is an extract adapted from the Panah Fund letter to investors for Q2 2021.1
As investors and regular readers know, Panah embraces a framework which employs various fundamental value-oriented strategies to build long exposures within the portfolio.2
The bulk of the portfolio is invested in ‘compounder’ companies, which tend to be companies with pricing power, high returns on capital and strong cash flow generation.3 We also have a few ‘deep value’ investments, which are companies with substantial value on the balance sheet (i.e., in cash or securities) which we hope can be unlocked by one or more catalysts.4
We also consider investments in highly cyclical companies, even commodity producers with little to no pricing power, so long as we have crunched the numbers for the whole industry or sector and have strong reason to believe that the cycle is bottoming. After a long downturn, the surviving companies in a sector are often trading at depressed valuations, and so the upside when the cycle turns can be dramatic. These are our ‘capital cycle’ investments.5
There are companies, of course, which fall in between categories (e.g., compounder companies which also have substantial undervalued investments), as well as sectors which evolve over time (e.g., sectors which were formerly highly cyclical can become more consolidated and less cyclical over time). On balance, however, we find that these category descriptions fit our investment style well.
The occasional uncategorisable exception lands within our ‘special sits’ bucket. Some of these are discrete, time-limited opportunities. Others have the potential, over time, to develop and eventually ‘graduate’ into another investment category (i.e., compounders).6
In this letter, we explain how Panah’s ongoing allocation to gold stocks fits into our investment framework.
TABLE OF CONTENTS
Reasons Not to Own Gold!
“…[A] major category of investments involves assets that will never produce anything, but that are purchased in the buyer’s hope that someone else – who also knows that the assets will be forever unproductive – will pay more for them in the future. Tulips, of all things, briefly became a favourite of such buyers in the 17th century…
The major asset in this category is gold, currently a huge favourite of investors who fear almost all other assets, especially paper money (of whose value, as noted, they are right to be fearful). Gold, however, has two significant shortcomings, being neither of much use nor procreative. True, gold has some industrial and decorative utility, but the demand for these purposes is both limited and incapable of soaking up new production. Meanwhile, if you own one ounce of gold for an eternity, you will still own one ounce at its end. What motivates most gold purchasers is their belief that the ranks of the fearful will grow.”
Warren Buffett, 2011 Berkshire Hathaway letter to shareholders (p.18)
We are sympathetic to the view that the majority of any portfolio should be invested in the equity of attractively valued, well-run companies which compound returns over time. Indeed, this is the primary investment strategy of the Panah Fund.
Mr Buffett is also right that an inanimate lump of physical gold does not grow over time, and thus cannot compound returns in the same way that an investment in a ‘good’ company can.
That is not to say, however, that gold cannot produce an income for investors. An investment in the equity of an operating gold miner usually pays dividends. Meanwhile, ‘gold loans’ can also produce attractive yields for owners of physical gold who are willing to lend out some of their bullion to junior miners.
Mr Buffett’s observation that investors tend to flock to gold out of a well-founded fear of monetary debasement is also true. When the supply of dollars (and other currencies) is growing faster than mines can up gold, the dollar denominator increases faster than the golden numerator.
Mr Buffett’s words of scepticism about gold were published in February 2012, soon after the gold price peaked in August 2011. This was rather timely, as the price of gold would not rise beyond these levels for another decade. It seems overly harsh, however, to imply that all buyers are waiting for a ‘greater fool’ to pay more for the same lump of metal.
After all, gold has played a gilded role in human history over thousands of years,7 as a store of value and as the mainstay of various monetary systems.8 That is a substantially longer life than any of the companies in which Mr Buffett invests. A simplistic critique of gold as “lacking a yield” and “unable to compound returns” also appears to misunderstand the role of collateral in the financial system.
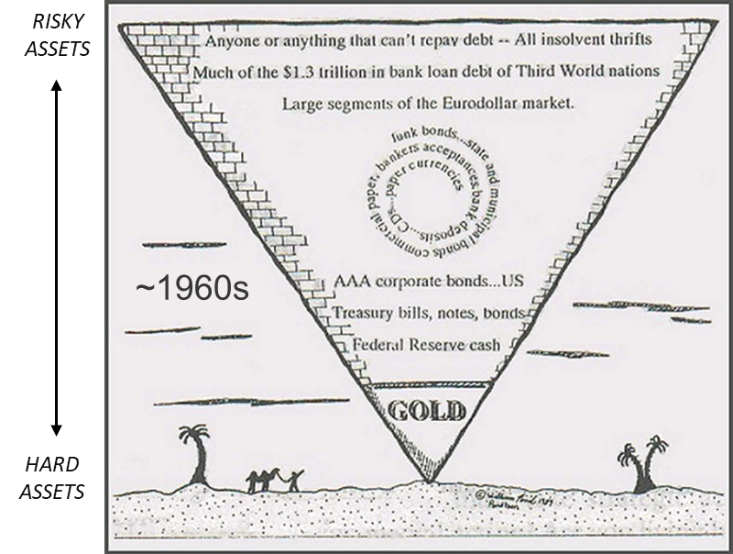
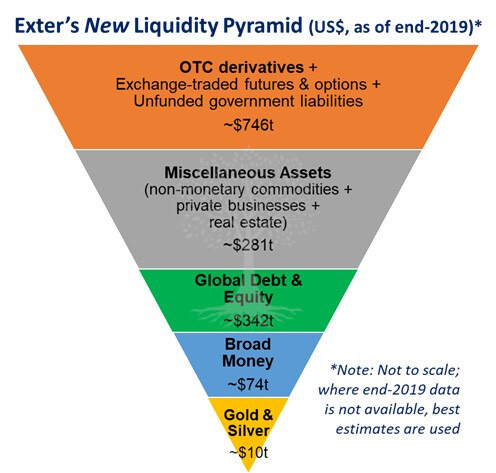
Indeed, the unique role of precious metals as the ‘ultimate collateral’ is what prompted John Exter to place gold and silver at the tip of his ‘inverted liquidity pyramid’ in the 1960s (Figure 2.1). Since then, the tiny point of the pyramid has only got smaller relative to the massive financial edifice above it (Figure 2.2).
As J.P. Morgan opined:
“[Credit] is an evidence of banking, but it is not the money itself. Money is gold, and nothing else.”
We think it hubristic to assume that gold will not play a role in monetary systems of the future or that it should not play any role within investors’ portfolios today.
Indeed, the world’s ‘omnipotent’ central banks – responsible for causing much of the asset price inflation which has helped to make Mr Buffett so rich – currently hold on average ~16% of their reserves in gold, a proportion which has increased over the last two decades. Some central banks would thus appear to believe that gold still has some role to play in the current international monetary system.9
The 79th element in the periodic table is an unusual animal – neither fish nor fowl. It shares characteristics similar to other commodities, but also, given its history, has more unique attributes which make it more akin to a monetary asset or a ‘hard currency’.10

It is perhaps this ambiguous nature which adds to the utility of gold within a portfolio. Simply put, gold behaves differently to other assets. Unlike equity investments, it also stands a better chance of performing well during times of rising prices. Indeed, during various inflationary periods – including the 1970s and the 2000s – gold has outperformed most other investments.
The unusual investment attributes of gold are perhaps the reason that Berkshire Hathaway did eventually decide to buy shares in Barrick Gold (disclosed in August 2020). Mr Buffett and his colleagues thus seem to have changed their minds about gold. (Admittedly, however, the Barrick holding was a tiny part of their overall portfolio and was divested before year-end.)11
Indeed, we believe that gold’s unique characteristics imply that the key question for investors should not be whether to hold any gold in a portfolio, but rather when to hold how much gold, and in what form?
To answer these questions, it helps to take a closer look at supply-demand dynamics, the macro drivers of gold, as well as the different types of possible investment in gold: coins, bullion, ‘paper’ gold, or gold equities. In this letter, we briefly examine these issues.
Macro Drivers of the Price of Gold
A couple of years ago, if any impartial observer had been presented with a hypothetical scenario involving the same massive level of fiscal and monetary accommodation that has been implemented over the last 18 months, a reasonable expectation would have been for the gold price to go “to the moon”. After all, the scale of recent global government stimulus packages and central bank asset purchase programs are historically unprecedented, and are probably tantamount to currency debasement.
After an initial pandemic panic liquidation to US ~$1,450/oz in March 2020, by early summer gold had quickly rallied past its 2011 high and into the low $2,000s. The gold price peaked in August 2020 against most currencies, and then gradually pulled back to US $1,675/oz in March 2021 before consolidating above this level.
The current gold price of US ~$1,800/oz is around 70% above the cycle lows of $1,050/oz reached in late 2015. Nevertheless, is it not perhaps still a lower price than one might have expected given the expansion of the monetary base in most developed economies over the last 18 months, as well as the weakness in the US Dollar over the same period?
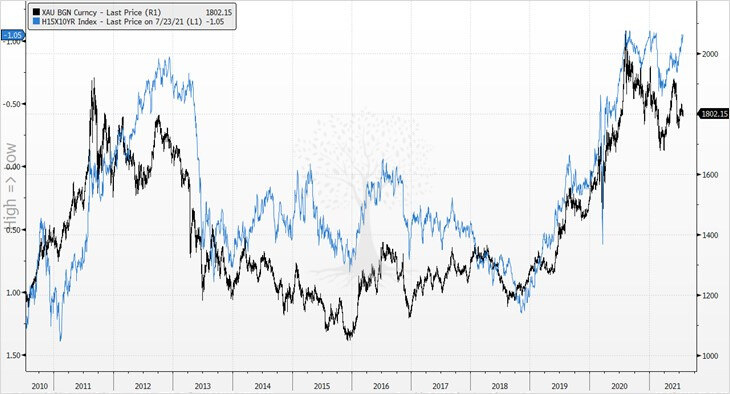
In fact, the price performance of gold has not really been out of sync with typical macro correlations. Over the last decade and longer, gold’s strongest correlation has been with US real interest rates. This strong inverse correlation has broadly held over the last two years, as the decline in real rates from ~0% in early 2020 to -1% by the summer coincided with a strong rally in gold which started in late 2018 (Figure 4).
This inverse correlation between gold and the US Dollar held from early 2020 until the summer, but gold then weakened in the last quarter of the year alongside the greenback. In hindsight, the main reason for this change seems to have been that the monetary debasement narrative of H1 2020 had morphed into a ‘reflation trade’ mania by Q4, boosting industrial commodities at the expense of more ‘defensive’ precious metals (Figure 5). As conviction in the reflation trade has waned in 2021, however, gold has traded sideways even as the US Dollar has staged a modest rebound.
Supply and Demand Considerations
Gold is unusual in that almost all gold ever dug up from the earth is still in existence. Ironically, much of it has been buried underground once again, in storage vaults at mints and banks.
The amount of gold mined in all of human history is tiny: only ~200,000 tonnes. All this gold would theoretically be able to fit inside a cube with sides less than 22m long (with a volume slightly greater than four Olympic pools, and significantly smaller than any Egyptian pyramid!).12

For any other commodity, inventories equivalent to almost ~100% of historically mined material would be alarming. Not so for gold, as the indestructible persistence of the metal – and difficulty in mining it – are exactly what gives gold its ‘store of value’ status and its enduring appeal.
When considering supply-demand dynamics for the yellow metal, however, it is true that one must think about ongoing demand for the large existing stock of gold as well as the more modest flow of newly mined material.
Since last year, the pandemic has also thrown a wrench into the finely oiled machinery of the gold market. In fact, the new patterns of gold supply and demand in 2020 as a result of the pandemic represent a complete break with the trends of the previous decade (Figure 7).
During the 2010s, the supply of gold was fairly stable at 4.3-4.8k t per annum. Mining accounted for ~70% of supply (growing at ~2% pa), with the remaining ~30% from ‘recycling’ (i.e., the annual resale from existing gold inventories).
Last decade, around half of all gold demand consistently came from jewellery purchases, with more than half of jewellery demand from China and India. In both countries, gold jewellery carries strong cultural meaning and also serves as a store of wealth.
The remaining gold demand broke down as follows: a high single-digit percentage for use in technological applications; a steady low-teens proportion from central bank buying (mostly Russia, China and Turkey); and a more volatile ~30% from investment demand (mostly bars and coins, with a low single-digit proportion from ETFs).
Another way of looking at the same data is that most physical gold mined over the last decade ended up in Asia, especially China and India. In contrast, the investment demand from western nations over this period was lacklustre.
The Covid-19 pandemic which emerged in early 2020 caused massive disruptions for many sectors. The gold market was no exception.
On the supply side, mine production fell by -4% in 2020 compared to the previous year as the pandemic shuttered mining operations. Gold recycling also dipped slightly as the virus closed pawnshops and prevented what would have probably been higher distressed gold sales by hard-up consumers. Aggregate supply in 2020 thus fell by -2% relative to the average for the previous decade.
In 2020, the fall in aggregate demand (relative to both 2019 and the previous decade) was in the mid-teens. Jewellery demand took a large hit, collapsing by almost -40% in 2020 relative to the previous year as Chinese and Indian consumers deferred purchases. As economic activity ground to a halt, technology and industrial demand for gold also suffered (-7% vs 2019).
Meanwhile, central bank net buying, which had risen during the 2010s, fell by more than -50% in 2020 (relative to average annual purchases during the previous decade). This was as some central banks divested gold holdings to pay for pandemic relief, while others decided to keep their powder dry and monitor pandemic developments.
In contrast, the saving grace for gold in 2020 was investment demand. There were fewer purchases of bars and coins than one might expect (i.e., flat relative to 2019 and down by -25% relative to average annual purchases during the previous decade), but this was probably due to supply bottlenecks and shortages of physical gold rather than a lack of demand. Indeed, bars and coins traded at a premium to the spot price in 2020, indicating a physically tight market.
Instead, the standout demand surge for gold in 2020 came from record investment into gold ETFs. Net buying of gold ETFs in 2020 more than doubled compared to 2019 and increased more than sevenfold relative to the annual average for the 2010s!
Starting in late 2020, however, we have seen the start of a relative ‘normalisation’ in the gold market. This trend has also been evident during Q1 2021. Mine supply started to rebound in the first quarter of this year, although recycled gold sales have been weak. This means that aggregate supply for Q1 2021 was similar to the same period in pre-pandemic 2019.
Even as supply has rebounded, aggregate demand for gold in Q1 2021 has been running at levels approximately -25% lower than the same period in 2019 and 2020. The key weaknesses have been a stunted recovery in jewellery and redemptions in gold ETFs.13
Future Supply and Demand Considerations
Certain elements of gold supply and demand are easier to predict than others.
For instance, in the future, it seems reasonable to assume that mine supply growth will not exceed historical norms (<2% pa), especially given limited exploration expenditure during the last decade (Figures 15-16).
On the other hand, supply from ‘recycling’ (i.e., disposals from existing owners) is likely to be more volatile as it depends on existing investors’ view of the relative attractiveness of gold versus other assets. Existing holders also tend to sell more gold as the price rises.
Gold recycling also increases at times of financial stress. For instance, last year in India – where gold plays a central cultural role – many of those affected by the pandemic took on loans to get through this difficult period, using gold jewellery as collateral. From Q2 2021, the resurgence of the delta variant of Covid-19 has meant that some cash-strapped Indian consumers cannot repay these loans, and others have little choice but to sell their jewellery to make ends meet. This means that more ‘recycled gold’ is reaching the secondary market.

On the demand side, technology and fabrication demand is relatively predictable: barring any new technological applications, industrial and technology fabrication will likely continue to decline slowly over time. Technology fabrication only represented ~8% of total demand last decade, so this is not expected to be a major swing factor for the gold price.
In contrast, other sources of demand – jewellery, central bank purchases and investment – are larger and more volatile. Jewellery has historically been the largest source of demand, representing more than half of all gold purchased last decade. In the western world, gold jewellery is associated with weddings and luxury use. On the other hand, gold jewellery in China, India and the Middle East often carries strong cultural meaning, serving as an investment and as a store of value.
As we have seen, the pandemic has dealt a short, sharp shock to jewellery demand. Nevertheless, our expectation would be for this to rebound as the global economy recovers.
Four-fifths of central banks around the world reportedly hold gold as part of their international reserves. During the 2010s, central bank demand for gold averaged ~11% of the total. A recent central bank gold survey by the World Gold Council (‘WGC’) indicated that most central banks plan to keep their holdings steady in the coming year, and a further 20% plan to increase them.
A recent WGC survey suggested the various reasons that central banks wish to hold gold as part of their reserves (Figure 10). One is for “historical” (legacy) reasons. Other factors include gold’s role as a “long-term store of value”, “effective portfolio diversifier” and as an asset with “no default risk”. In the wake of the pandemic, the survey indicated that the most important reason that central banks hold gold is now “performance during times of crisis”.
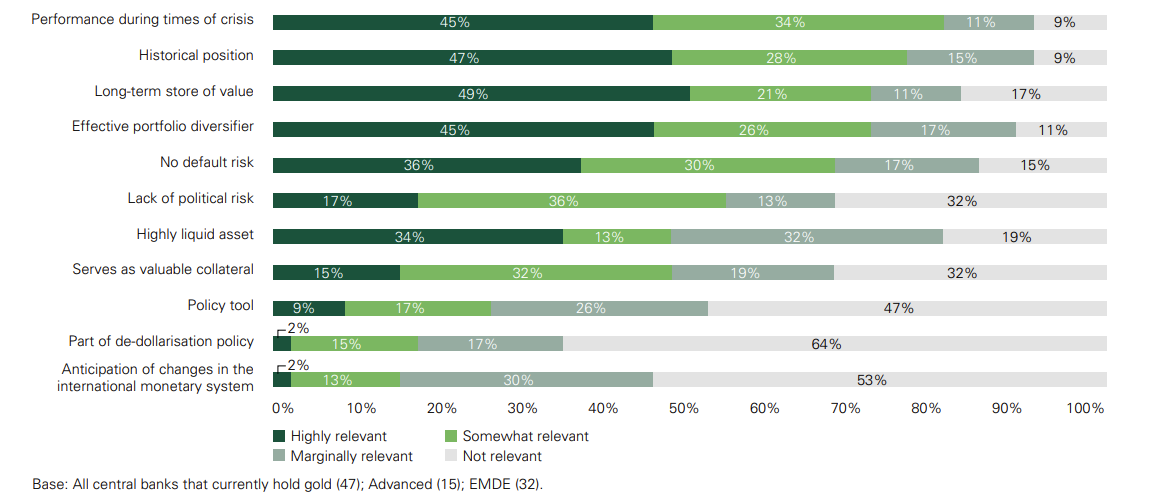
Unsurprisingly, few central banks are willing to admit publicly that their gold holdings are part of a de-dollarisation policy, or that they are diversifying reserves in anticipation of change in the international monetary system. Nevertheless, it would be naïve to presume that central banks (as well as individual investors) are not reconsidering their portfolio allocations given recent global surges in monetary and fiscal stimulus. Given the low or negative yields on offer from Developed Market government bonds, the opportunity cost of higher gold allocations is now much lower than at any point in the past.
Increasing geopolitical tensions are also adding some complexity to the situation, as it seems unlikely that China and Russia (or indeed any other countries in their sphere of influence) will add to their holdings of US Treasury securities anytime soon (if ever). Indeed, both countries’ holdings peaked earlier last decade, and Russia has since 2018 disposed of almost all of its Treasuries. Gold is one of the natural candidates for increased allocations within these nations’ reserves.
Investment – in both bars and coins, as well as gold ETFs (backed or unbacked by physical gold) – is the biggest swing factor when it comes to gold demand. While purchases of bars and coins might well be stickier than for ‘paper gold’ (as transaction costs and premiums tend to be higher), investment in ETFs is extremely volatile.
In the near-term, net ETF creations/redemptions seem to be the mostly likely source of swings in gold demand. Nevertheless, should worries over physical shortages of gold arise in the future, we would not discount the possibility of a ‘panic’ out of ETFs and paper gold and into bullion and coins.
Investment Demand for Gold in Various Macro Scenarios
When it comes to the decision as to whether to invest more in gold, portfolio allocation and macro considerations often come to the fore.
Investors who have in recent decades adopted 60/40 (equity/bond) asset allocation models or levered versions thereof (e.g., ‘risk parity’), are now thinking hard about whether bonds will still be effective as a hedge for multi-asset portfolios in the 2020s. Large investment managers such as Bridgewater have openly discussed increasing their gold holdings as they pare back their fixed income allocations.
Gold, however, is not a panacea. There are various circumstances in which gold will likely lose money for investors, in both relative and absolute terms.
For instance, in sudden market downdrafts, forced liquidation of levered positions can often cause a sudden sell-off (as happened in late 2008 and also March 2020). Gold thus does not necessarily serve as a good short-term portfolio hedge, as such price declines can coincide with weakness in equities and other assets. The saving grace is that the gold price often rebounds fast from such liquidation events (as central banks rush to increase liquidity), pushing gold to new highs soon after.
In certain macro scenarios, gold is likely to perform more poorly over a sustained period of time. For instance, in a sustained disinflationary environment (like much of the 2010s) or if real rates increase and stay at a higher level for a long period of time, gold is likely to underperform other assets. Given current hyper-easy policy settings and rapidly increasing global debt levels, however, we see the latter outcome as unlikely in the near future.
Indeed, given the massive global debt loads built up over the last 40 years, it seems likely that central banks will now do all they can to cap nominal interest rates and depress real yields (in an attempt to reduce overall debt levels in real terms).
If interest rates do rise, however, the Fed and other central banks will be faced with some tough decisions over whether to cap interest rates with measures such as ‘yield curve control’ (‘YCC’). If formally implemented, YCC would likely cause a massive surge in the price of hard assets, including precious metals.
As US headline consumer price inflation growth has surged to more than 5% year-on-year, some investors are now also starting to focus on the rapidly falling level of real rates based on US CPI. If investors start to believe that inflation is becoming entrenched – and not ‘transitory’ as the Fed claims – this might allow nominal interest rates and the gold price to move higher together (as real rates stay low or decline).
It would be remiss not to mention that in this cycle, gold seems to have a new competitor for its ‘store of value’ status. This of course comes in the form of supply-constrained cryptocurrency assets such as Bitcoin. This has undoubtedly drawn away new, would-be buyers of gold into this new, ‘tech-tastic’ digital asset class.

Needless to say, most major cryptocurrencies have massively outperformed gold since early 2020, even taking into account the sharp crypto correction since May 2021. Gold might yet regain its lustre, however, especially if a much-feared regulatory crackdown on digital assets ever comes to pass.
As we have mentioned in previous letters and presentations,14 we are sympathetic to the view that inflation – or more likely stagflation – will take hold at some point in the 2020s. The response to the pandemic has broken plenty of monetary and fiscal taboos, and the new Zeitgeist overtly seeks to boost the gains accruing to labour over capital. This is in sharp contrast to the policies of the last 40 years, and on balance we think this is likely to lead to higher general price levels.
Gold would probably serve as an effective hedge against this outcome (which would also likely be a difficult environment for equities). At the very least, we expect gold to keep pace with the monetary debasement being pursued by governments and central banks around the world. For these reasons, and from a portfolio diversification perspective, it thus does not seem unreasonable for investors to consider allocating part of their portfolios to physical gold.
Investing in gold stocks – explorers, developers, miners and royalty companies – adds some more interesting dimensions. Here, investors must not only think about the possible price of gold, but also the complexities and costs of finding the ore, building the mine and extracting the metal.
In addition to such fundamental factors, there are also market idiosyncrasies such as dilution, valuations and behavioural considerations (e.g., passive investing flows). As a result, we see inefficiencies which can be exploited within the gold sector and at the single stock level.
The Case for Gold Stocks
Back in 2001, gold had been in a bear market for ~20 years, and one Troy Ounce of the metal could be purchased at a price of US ~$250. At that time, David Watt, the founder of AIMS Asset Management,15 made a contrarian decision by calling the end of the two-decade downcycle in gold, and started to consider investing in gold stocks.
At the time, there were few remaining funds which invested exclusively in gold miners. Moreover, the top investments of the few surviving funds were mostly major miners which had aggressively hedged their future production, thereby limiting their upside leverage to the gold price (in some cases, even risking insolvency16 if the gold price spiked) – the opposite of what he wanted.
David thus decided to set up a fund of his own to invest in gold miners and juniors, and the Phoenix Gold Fund was born. This proved to be an auspicious time to invest in the equity of unhedged gold miners. The fund performed extremely well over the next decade as the price of gold rose to a high of US $1,920/oz in 2011.
Unfortunately, in this tremendous bull market, many gold miners lost their discipline. Costs blew out, low grade deposits were pushed into production, and optimistic acquisitions proliferated. This laid an extremely poor foundation for the following decade, and most gold stocks spent the 2010s with a bad hangover, working off the excesses of the previous boom.
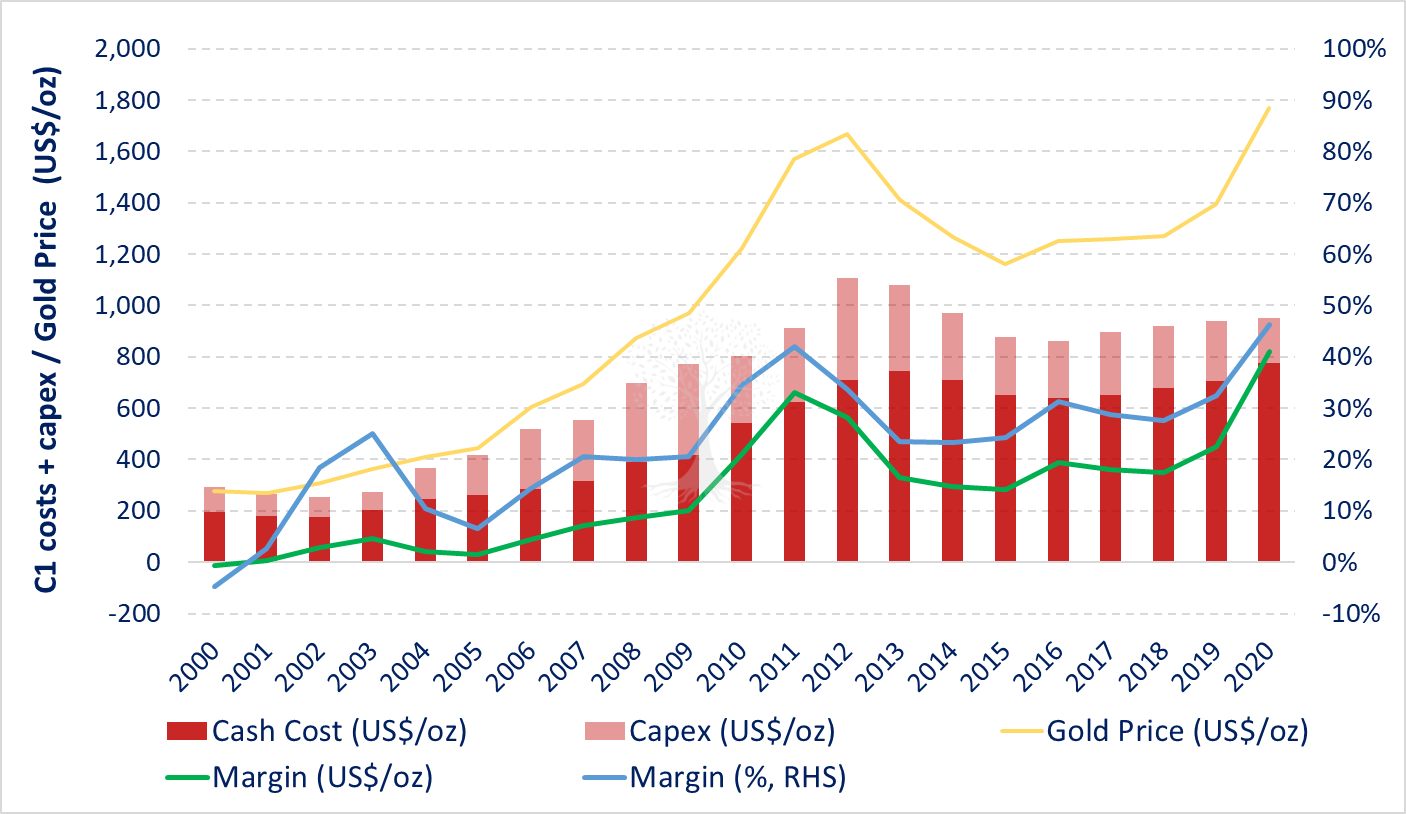
The present-day fundamentals for the gold sector, however, look markedly different. Even as the gold price has risen from the late-2015 low of US $1,050/oz, gold miners have for the most part listened to investors and attempted to maintain capital discipline. This has meant controlling costs and not gearing up to pursue acquisitions.
The result has been higher margins for gold miners and rising free cash flow as the gold price has risen (Figure 12).17
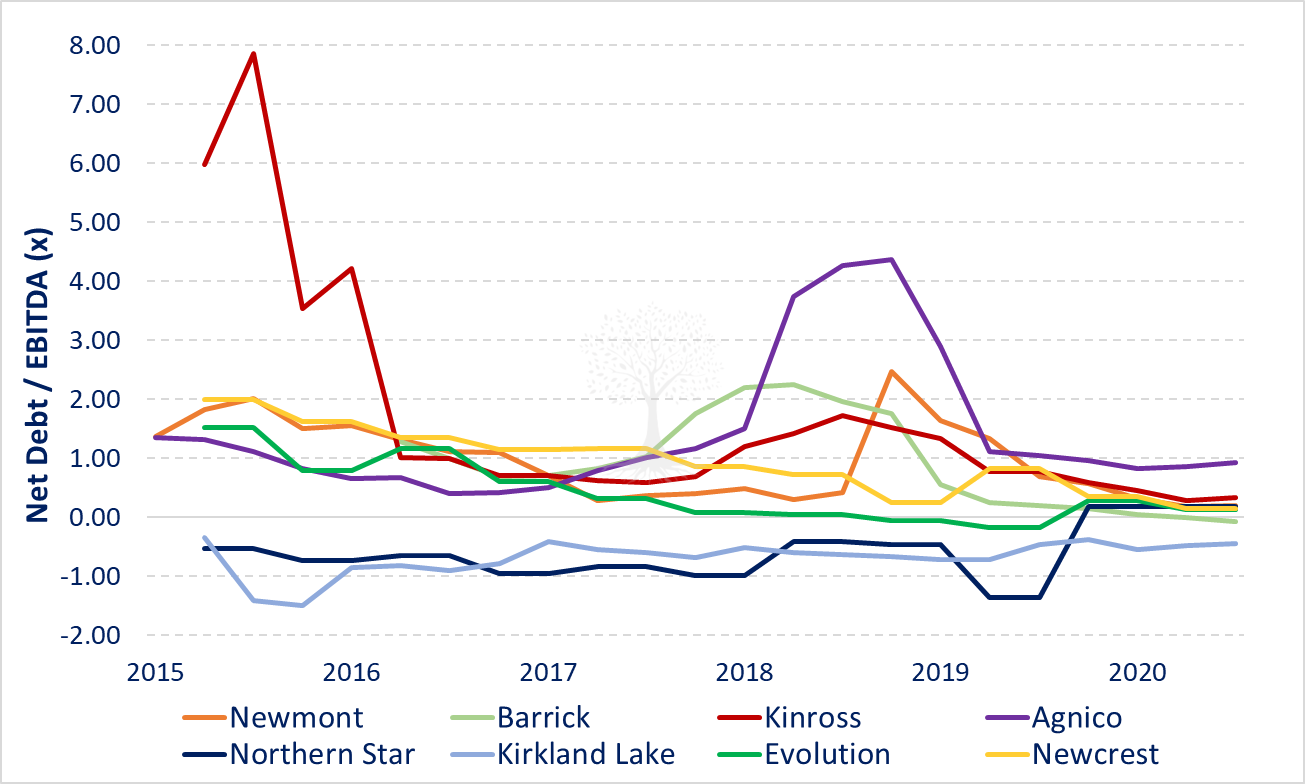
It has also meant lower gearing levels for the major gold producers (Figure 13), as in recent years they have often tended to pay for acquisitions in scrip rather than borrowed money.
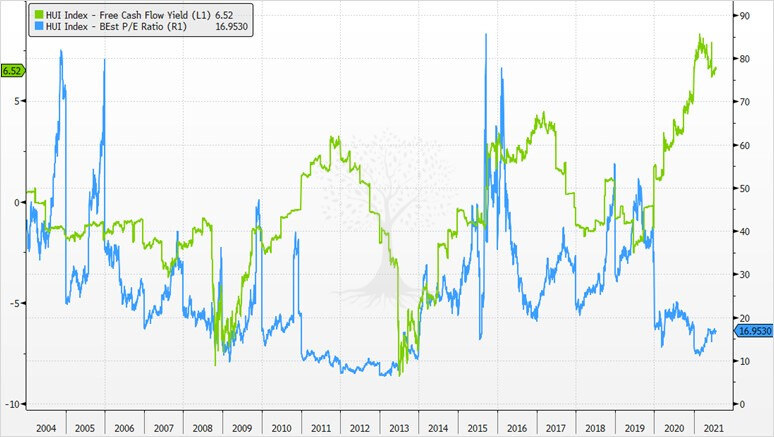
Improving fundamentals – cost control and lower gearing – mean stronger cash flows. Moreover, the valuations on offer throughout the gold sector (using the HUI index as a proxy) are now among the cheapest they have been in years (Figure 14).18 The relative valuation of gold stocks versus major indices (especially the US) and versus particular sectors (such as tech) are also extremely attractive.
As a result of this new-found capital discipline in the gold sector, in recent years the gold miners have been investing less, leading to fewer discoveries (Figure 15).

Less exploration (and fewer good deposits) in turn means that production growth among the world’s top gold miners (i.e., those listed on the TSX and ASX) is only expected to grow by only 1.6% in total over the five years to 2025 (Figure 16).
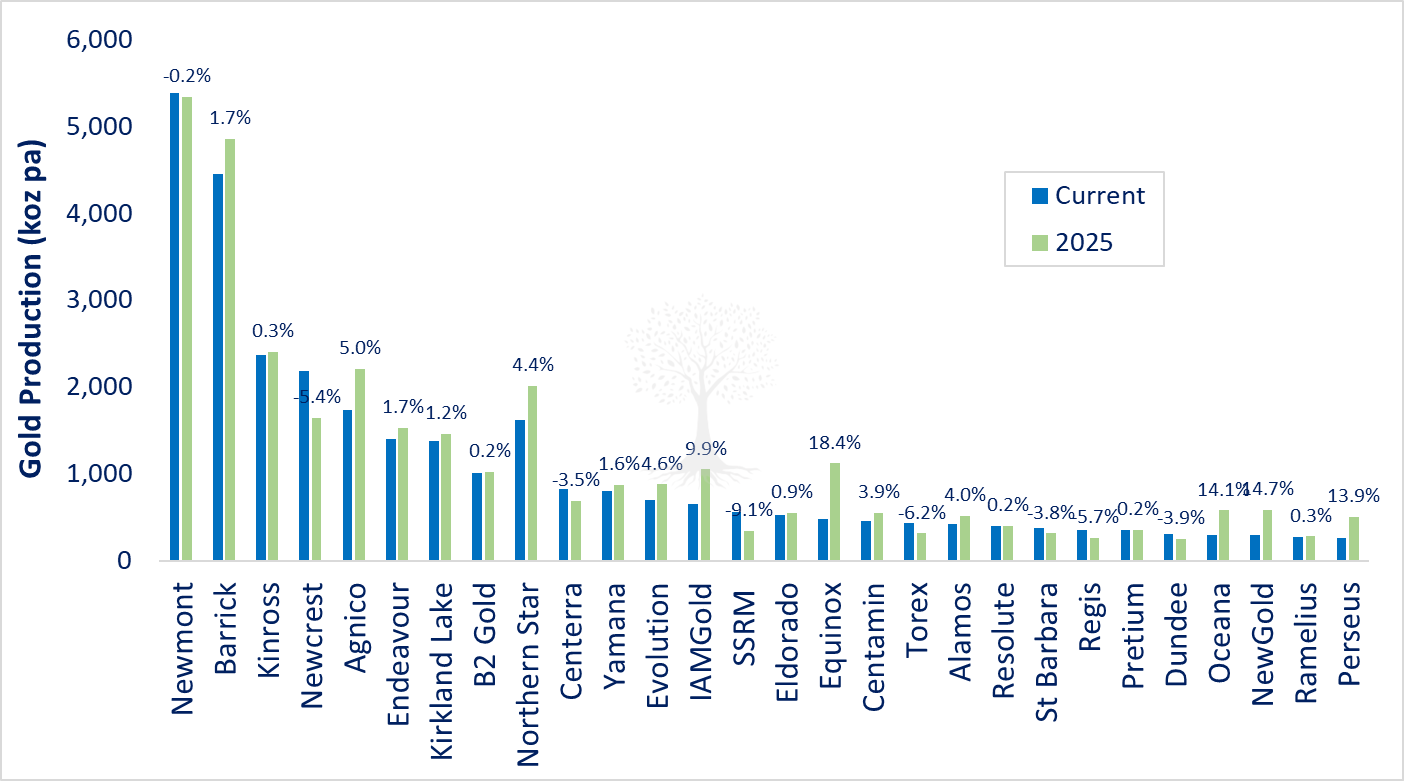
Moreover, much of the modest incremental production expected from the majors reflects recent M&A activity rather than organic production growth.19 Given that many miners are enjoying higher margins and strong cash flows but are also facing a constrained production profile, it seems likely that many companies will feel pressured into making acquisitions in the near future. Indeed, as Covid-19 travel restrictions start to lift in H2 2021 and 2022, we expect to see many more takeover announcements in the sector.
For investors who wish to build a diversified portfolio of gold stocks, it thus makes sense not only to hold a few major producers (which, as we have seen, are generally trading at attractive valuations) but also a selection of strategically selected gold developers and explorers that are likely to become takeover targets. These tend to trade at significantly cheaper valuations. (For instance, our universe of ASX developers and explorers currently trade at a ~40% discount to the majors on an EV/resource oz basis.)
While it is possible to gain a diversified and cost-effective exposure to a selection of major gold miners by investing in a gold stock ETF (e.g., the VanEck Vectors Gold Miners ETF, ‘GDX’), such funds no longer have any exposure to some of the smaller and more interesting developers and explorers. Those ETFs which used to invest in small-cap gold stocks (e.g., the VanEck Vectors Junior Gold Miners ETF, ‘GDXJ’) have become ‘too popular’ and so now focus on investing in mid- to large-cap gold miners and developers rather than smaller junior gold stocks.20
The relative paucity of passive flows and investor interest in the small- and mid-cap gold space makes for greater inefficiencies, which has been good news for bottom-up stock pickers. As these junior gold miners have sought to raise capital, this has also meant that for much of the last decade, investors have often been able to negotiate better terms (e.g., equity issues involving discounts to market price or attached warrants).
Indeed, it proved difficult for the gold juniors to raise money from investors during the weak gold price environment of 2013-2019. As the gold price has strengthened over the last 18 months, however, the financing drought has come to an end.
Junior gold stocks and other miners have suddenly been able to start raising large amounts of money from the equity capital markets (Figures 17.1-17.2). Indeed, it seems as if barely a day goes by without emails in our inboxes from various resource sector investment bankers and brokers touting the latest deal.
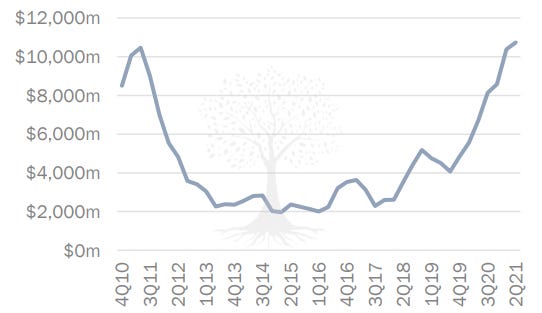
Much of this new mining capital has been earmarked for exploration spending. Given the challenges of Covid-19, however, which has included lockdowns and travel restrictions for miners and drillers in most key mining jurisdictions, it has proven difficult for many resource companies to spend their exploration budgets.
As some of the pandemic restrictions are relaxed, exploration spending is now expected to surge; S&P is expecting ~20% growth for mining spending in 2021. Supply for drill-rigs and skilled labour is now extremely tight – capacity utilisation is spiking, and cash flows are rising fast. It’s a good time to be a driller!21
Even if this exploration spending were to be extremely successful, however, the fastest timeframe that new gold mines can realistically be developed is three years (i.e., for smaller, brownfields developments in Australia). In most cases, it would take 5-10 years for new, major discoveries to be defined and for first gold to be poured.
Then, all that is required is sensible stock-picking within this inefficient sector. Thankfully, Panah is able to lean on the expertise of our colleagues David Watt and Larry Hill at our sister fund, the Phoenix Gold Fund, to help find the best companies for the portfolio.
Putting it all together, we believe that the current macro backdrop, the unusual attributes of gold, the attractive valuations on offer for the gold stocks, and the inefficiencies within the gold sector argue for higher allocations towards carefully selected gold equities. We thus plan to maintain our investment activity in this area.
Thank you for reading.
Andrew Limond, Larry Hill
The original source material has been edited for spelling, punctuation, grammar and clarity. Photographs, illustrations, diagrams and references have been updated to ensure relevance. Copies of the original quarterly letter source material are available to investors on request.
For an explanation of our value-oriented investment framework, see the Panah Fund letter to investors for Q3 2017, as well as the following Seraya Insight: ‘The Trials & Temptations of a Value Investor’.
For an explanation and an example of our ‘compounders’ investment approach, see the Panah Fund letters to investors for Q3 2018 (pp.4-9) and Q4 2020 (pp.7-10), as well as the following Seraya Insights: ‘“Compounders”: The Ultimate 'Lazy' Investment Choice?’ and ‘Case Study of a Testing “Compounder”’.
For an explanation and an example of our ‘deep value’ investment approach, see the Panah Fund letters to investors for Q2 2018 (pp.6-8) and Q3 2021 (pp.3-11), as well as the following Seraya Insights: ‘Shareholder Engagement & Activism in Asia’ and ‘“Growth in Value”: Investing in Value Stocks with 'Hidden' Growth Assets’.
For an explanation of our approach to ‘capital cycle’ investments, see the Panah Fund letters to investors for Q4 2018 (pp.8-12) and Q1 2019 (pp.4-12), as well as the following Seraya Insights: ‘“Capital Cycle” Investing: The Market-Cycle Diaries’ and ‘Anticipating the End of the Downcycle in a Radioactive Sector’.
For examples of our ‘special sit’ investments, please see the Panah Fund letters to investors for Q3 2015 and Q2 2023, as well as the following Seraya Insights: ‘Two Case Studies: a Japanese 'Deep Value' Investment & a Thai 'Special Sit' Turnaround Opportunity’ and ‘Two 'Special Sits': Vietnamese Convertible Bonds and Sri Lankan Local Government Debt’.
A definitive history of the yellow metal can be found in: ‘The Power of Gold: The History of an Obsession’ (2000) by Peter L. Bernstein.
Winton provides a historical summary of the international monetary system since 1870, including gold.
A recent World Gold Council central banks survey shows continued interest in gold. Note that our analysis is limited to central bank holdings reported to the WGC; gold leasing and other practices can distort this picture.
This is also true for silver, though as it has more industrial uses, silver’s behaviour finds itself more halfway between industrial commodity and precious metal.
For details on how Berkshire Hathaway appears to be increasing its ‘inflation hedges’ (including in Japan), see the Panah Fund letter to investors for Q3 2020 (pp.6-8) and the following Seraya Insight: ‘Japan: Warren Buffett Takes the Plunge & Yoshihide Suga Take the Reins’.
Assuming Olympic swimming pool dimensions of 50m * 25m * 2m = 2,500m³.
In more detail, jewellery purchases have jumped by around +50% in Q1 2021, although this level of demand only recoups half the damage done by the plague year. Meanwhile, technology fabrication demand recovered to pre-pandemic levels in the first quarter with the rebound in the industrial cycle. Central bank demand was lacklustre in Q1, with Turkey and the Philippines as major sellers (to fund fiscal support in the midst of the pandemic), and Hungary and Uzbekistan as major buyers. The central bank of Thailand has also appeared as a major buyer of gold in April-May 2021. Investment in bars and coins recovered strongly in Q1, and if this run-rate can be maintained, this would make 2021 the best year for bars and coins demand since 2013. On the other hand, net ETF purchases have continued to act in a procyclical fashion, with demand cratering into negative territory in Q1 2021 (i.e., net redemptions) as the gold price weakened. In Q2, the recovery in ETF demand remained weak.
For more information, see the Panah letters to investors for Q4 2019, Q1 2020, and Q4 2020, as well as the following Seraya Insights: ‘Four Big Picture Predictions for the 2020s’, ‘Covid-19: the Catalyst for a Massive Shift in the Zeitgeist’ and ‘Making Sense of Markets in the Covid-19 Era: Historical Precedents & What to Expect’. The December 2020 Panah presentation ‘The outlook for Asian markets in 2021 and beyond’ (available to investors on request) also provides additional information.
AIMS Asset Management Sdn Bhd was the investment manager of the Panah Fund from inception until November 2022.
The story of Ashanti’s gold hedge book is a salutary tale of the risks of gold hedging.
Figure 12 uses composite data from two sources: Bullion Vault data on the top 14 gold producers for 2000-2015, and Gold Focus data for globally mined gold supply for 2016-2020.
The HUI index is the popular name (and stock ticker) for the NYSE Arca Gold BUGS Index, a “rules-based, modified equal weighted equity benchmark designed to track the performance of companies involved in the mining of gold ore that do not hedge their production beyond 1.5 years”. The index currently consists of holdings in 14 of the world’s largest gold miners.
For example, Northern Star + Saracen, and Equinox + Premier.
For more information, see the Panah Fund letter to investors for Q2 2017 (p.10) and the following Seraya Insight: ‘Passive Aggressive’.

