Defying Gravity: The Liquidity Conundrum
How asset prices have remained elevated despite higher interest rates
This Insight is not investment advice and should not be construed as such. Past performance is not predictive of future results. Fund(s) managed by Seraya Investment may be long or short securities mentioned in this Insight. Any resemblance of people or companies mentioned in this Insight to real entities is purely coincidental. Our full Disclaimer can be found here.
This Insight is an extract adapted from the Panah Fund letter to investors for Q1 2024.1
Time flies. Looking back from our vantage point almost halfway through the ‘new’ decade, most of us simply didn’t realise just how good we had it in the 2010s!
Since the start of 2020s, the world has experienced a global pandemic (when even the healthy were quarantined), a bloody land war in Europe which is entering its third year, and now a rapidly deteriorating situation in the Middle East. During this decade of instability, it would be foolish to assume that there are not more surprises waiting in the wings.
Despite these challenges, the first quarter of 2024 witnessed a continuation of the unstoppable ‘global’ equity rally led by the US.
Many, including us, had been expecting that belated but rapid interest rate increases by the Federal Reserve (the ‘Fed’) from 2022 would eventually catalyse a US recession and a bear market. Instead, other than a slight slowdown and a couple of quarters of lower earnings in 2023, the US economy has remained resilient and most companies are prospering.
Indeed, US economic growth appears to be reaccelerating and inflation picking up once again, thereby supporting global growth. US stocks have been buoyant.
Indeed, despite US interest rates above 5%, markets are also behaving as if money is plentiful.
Not only did the Nasdaq manage to hit a new high in March, but Bitcoin and gold have also recently reached new all-time price records. Other selected stocks and equity indices which are beneficiaries of strong fundamentals and narratives (e.g., AI, India, and Japan) have also been surging higher. Stocks and other speculative assets have caught a bid!
Where on earth is this liquidity coming from?
This is an important question, and at first glance the answer is not obvious.
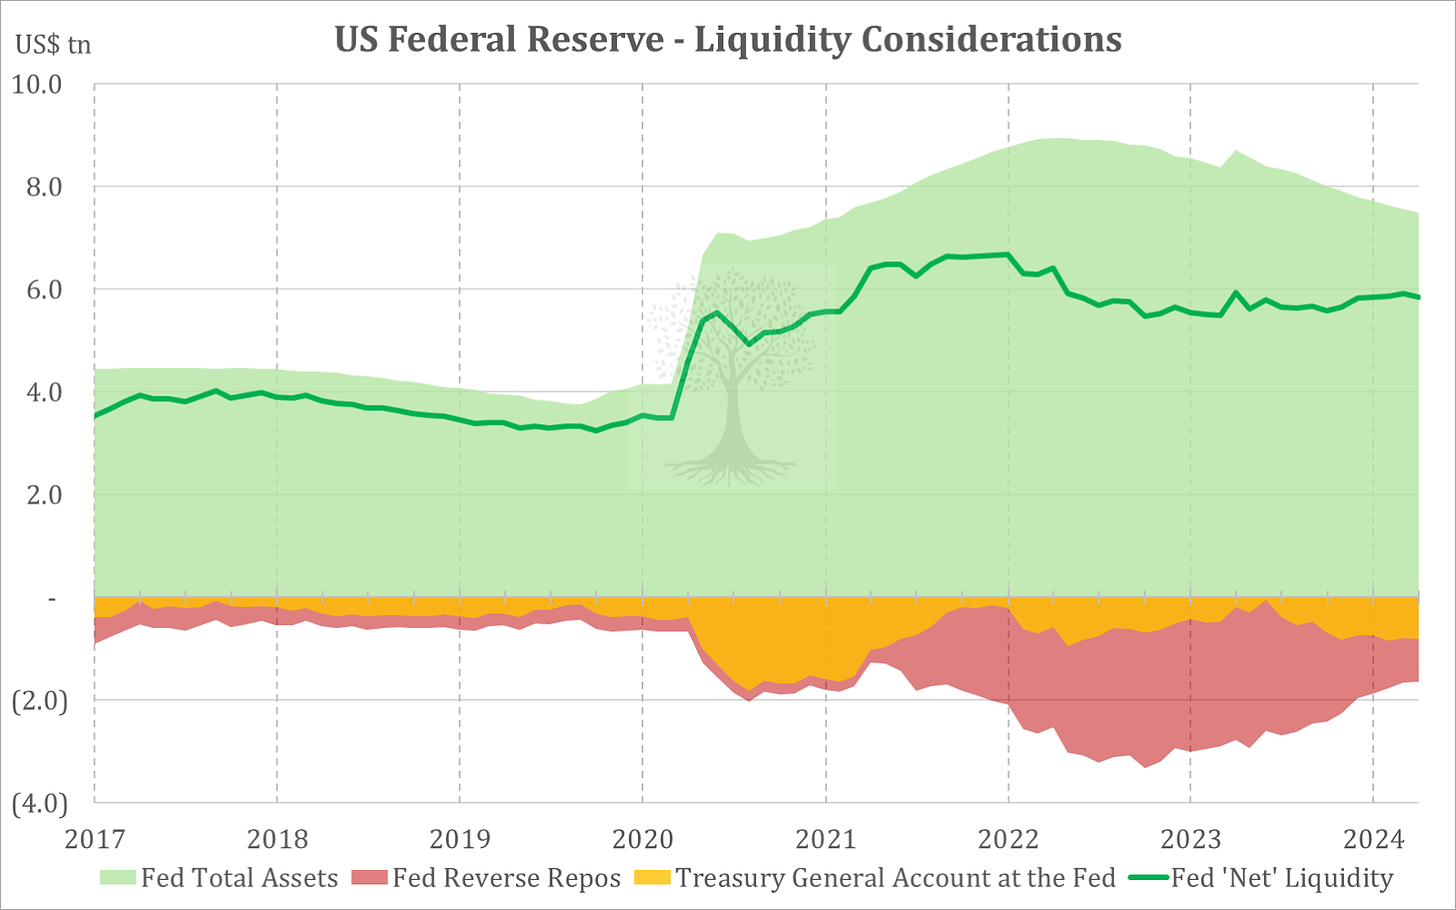
The Fed’s balance sheet has been shrinking since mid-2022 thanks to Quantitative Tightening (‘QT’). Another ‘negative liquidity’ factor has been the general rebuild in the Treasury General Account since mid-2023 (Figure 1). Weak bank lending since 2022 has also been a drag.2

Over the last 18 months, however, all these considerations have been more than offset by a massive drawdown in reverse repo agreements at the Fed (Figure 1). This has provided a colossal US ~$2tr in additional liquidity over the last year and could still theoretically provide a further ~$500bn in liquidity in the coming months.
There have also been a variety of other important factors supporting US growth and liquidity, including:
The continuing impact of massive excess money creation during the Covid period – M2 has only recently reverted to its long-term trend relative to nominal GDP (Figure 2);
Eyewatering fiscal largesse – the US budget deficit is still running at -5.9% and will likely grow further in coming years;
Ongoing low unemployment and resilient consumption, partly stemming from a desire this cycle to hoard ever scarcer workers; and,
Lower energy prices, especially natural gas.

Looking beyond the US, money outflows from Japan have been accelerating as Japanese households reach for yield abroad while trying to escape low interest rates at home and the rapidly depreciating Yen. This has likely helped support asset prices outside Japan.
The Bank of Japan has recently taken a belated first step towards normalising monetary policy. Given massive interest rate differentials with other countries, however, it will likely take more than nudging interest rates from slightly negative to slightly above zero to arrest the money flows from Japan.
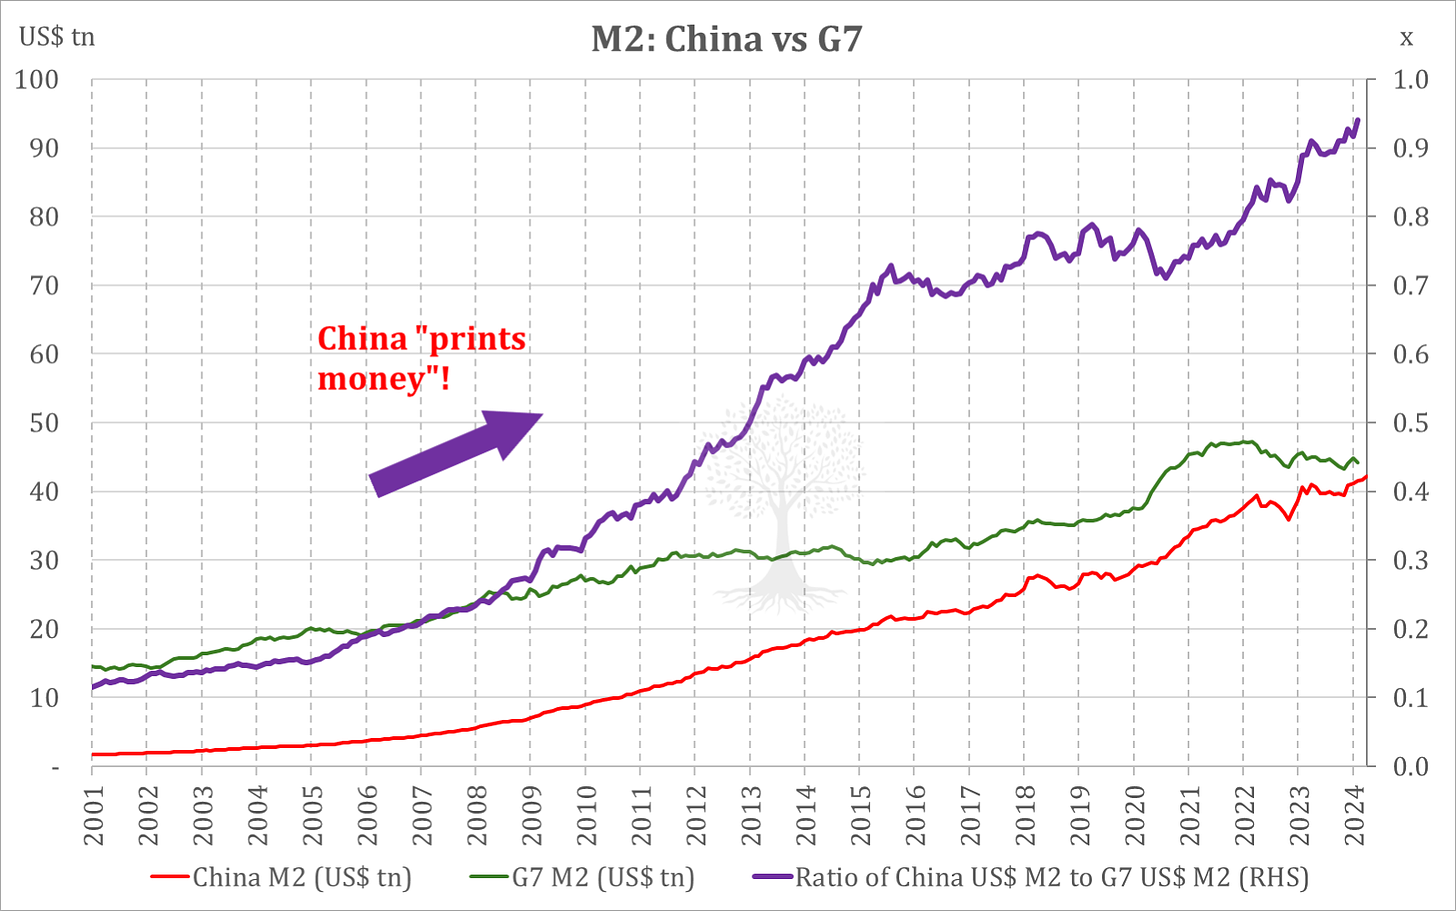
It is notable that China is now the one major global economy which appears to be happy to continue pushing broad money growth (especially relative to fading nominal GDP). Looser liquidity presumably represents an attempt by the authorities to soften the adverse impact of China’s real estate market troubles and other woes afflicting the economy.

It is notable that China’s M2 is now almost equal to the money stock of all G7 countries combined, despite the fact that China’s GDP is less than 40% of these seven nations’ collective total! Chinese money flows are thus very important when considering global money liquidity.
Of course, these Chinese money flows are partially impeded by domestic capital account restrictions. Nevertheless, Chinese buying appears to be helping to support the physical gold market. This is presumably in the absence of other good investment opportunities at home. Despite Chinese restrictions on cryptocurrency, we would be surprised if some of the money minted in the country were not finding its way into this speculative market too.
Notably, despite all this ‘liquidity’ sloshing around, US Treasury yields continue to rise.3 Many trade partners, including China, are no longer recycling their export earnings into US government securities.
These dollars are thus free to flow elsewhere, into other asset classes (including gold). Other countries, for instance in the Middle East, also seem keen to diversify their saving into largescale infrastructure and megaprojects (including ‘cities of the future’ in Saudi Arabia and Egypt).4
In coming years, the growing US deficit and this waning structural bid for US Treasuries will likely become an important point of conversation.
In the near term, however, investors will more likely be focused on just how much longer the liquidity will last. This money wave has helped to power asset prices higher, and a sudden stop would be disruptive.
In April, we are witnessing a hiccup in money flows amid rising geopolitical risks, and this has started to weigh on asset prices. Our best guess, however, is that liquidity will stabilise soon and probably remain supportive until the summer. This dynamic is constantly evolving, however, and so needs to be monitored closely.
Thank you for reading.
Andrew Limond
The original source material has been edited for spelling, punctuation, grammar and clarity. Photographs, illustrations, diagrams and references have been updated to ensure relevance. Copies of the original quarterly letter source material are available to investors on request.
Weak bank lending in the US has largely been offset by the enormous surge in private credit markets over the last five years.
Expectations of reduced T-bill issuance from May-July this year might cap yields in the near-term, although this will also depend on the trajectory of QT.
We anticipated this incremental ‘dedollarisation’ process (and more robust central bank demand for gold) following the US reaction to the Russian invasion of Ukraine. For more details, see the Panah Fund letter to investors for Q1 2022 and the following Seraya Insight: ‘Reflections on the Russo-Ukrainian War and a “New World Order”’.


