Why Asia's Market Inefficiencies = Opportunities
Asia is home to some of the most inefficient markets on earth
This Insight is not investment advice and should not be construed as such. Past performance is not predictive of future results. Fund(s) managed by Seraya Investment may be long or short securities mentioned in this Insight. Any resemblance of people or companies mentioned in this Insight to real entities is purely coincidental. Our full Disclaimer can be found here.
This Insight is an extract adapted from the Panah Fund letter to investors for Q4 2019.1
Adherents of the Efficient Market Hypothesis would claim that it is a fool’s errand, full of conceit, to imagine it might be possible to construct a concentrated portfolio of 15-20 stocks that manages to capture the positive right tail of stock returns.2 In the last decade in the US, it has indeed proven extremely hard for active managers to beat their benchmarks, not least because of the flow of funds towards passive investment managers who ‘buy the benchmark’.3
Media interest in the recent underperformance of US large cap active strategies often means that people assume that active underperformance is prevalent in all markets and for all stocks. In reality, however, this varies by time and place.
In theory, it should be hardest for active strategies to outperform in better-researched and more efficient markets such as the US, while less-researched markets and sectors should provide more opportunity for investors to pick stocks effectively and make differentiated returns.
Indeed, the major reason that we are optimistic and enthusiastic about active investment in Asia, is that Asia is home to some of the most inefficient markets on earth!
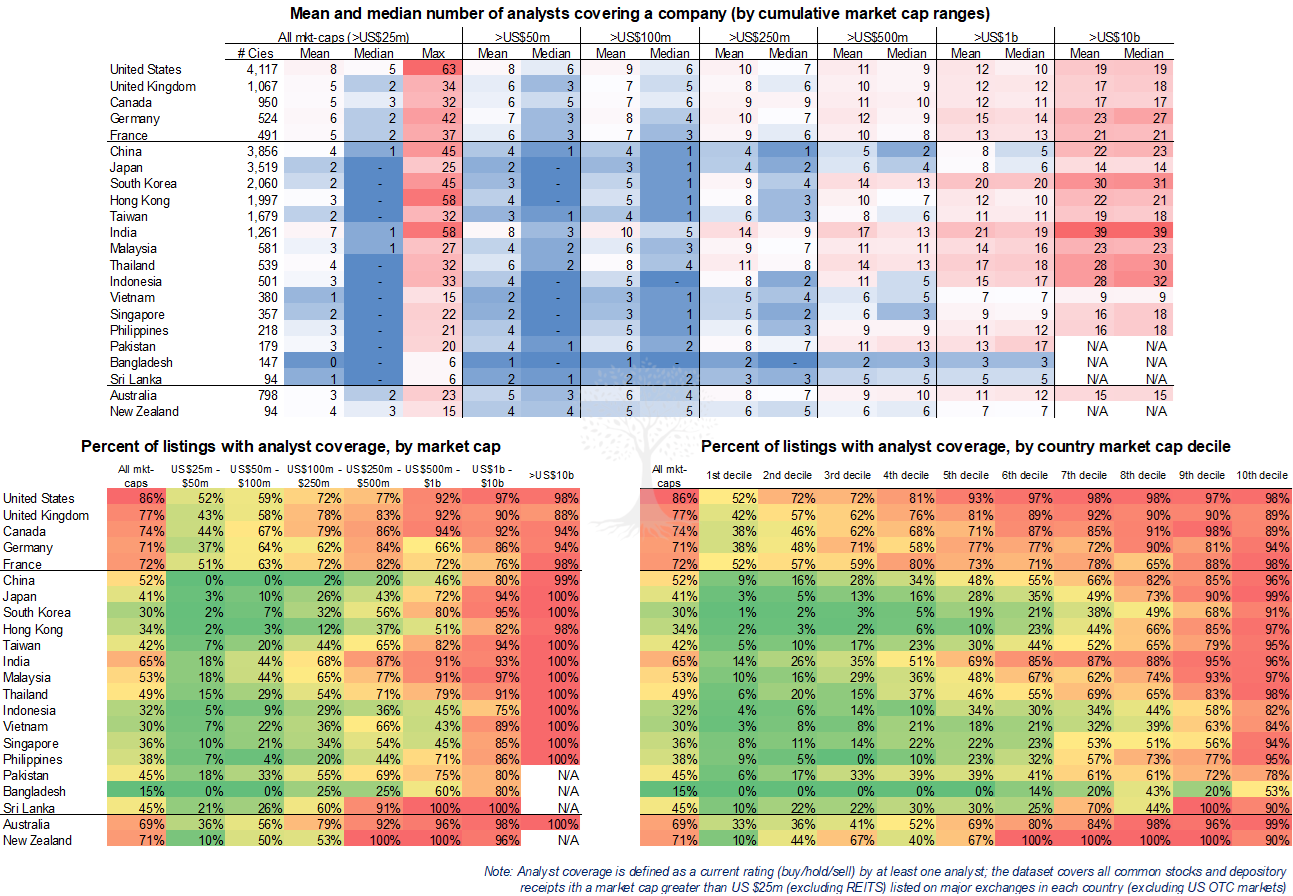
We have attempted to quantify this phenomenon by using sell-side analyst earnings coverage of listed stocks as a proxy for market inefficiency.4 There are various ways to slice and dice the data, as presented below (Figures 1.1-1.3).

First, we have calculated the mean and median number of analysts per stock by market cap across Asia, as well as in the US, Canada and select European markets (Figure 1.1). The table is colour-coded for convenience (red = more analysts, blue = less analysts).
Unsurprisingly, the US has the largest average number of analysts across all market caps, even among the small- and mid-cap stocks. This pattern is repeated across Canada, Europe and Australasia, although to a lesser extent than in the US. In Asia, there are relatively high levels of average analyst coverage at market caps of US >$250mn in Malaysia, Thailand and especially India. Conversely, Asian countries with low absolute average analyst coverage include Japan, Vietnam, Singapore, Bangladesh and Sri Lanka.
Second, we then considered what percentage of stocks in each country are covered by at least one analyst, calculated by market cap range (Figure 1.2). The table is colour-coded (red = more coverage, green = less coverage).
In the US, 86% of all stocks (with a market cap greater than US >25m) are covered by at least one analyst. Coverage rates are also relatively high (at ~70% or more) in Europe, Canada and Australasia. The lowest coverage rates for stocks of all market caps (US >$25mn) are in Bangladesh, Vietnam and South Korea (15%, 30% and 30% respectively). Coverage rates among mid-cap stocks are also low in China and Indonesia.
There is, however, a slight problem with analysing analyst coverage ratios within a USD market cap range: this method does not take into account the market cap distribution of stocks within each country (developed markets tend to have many more listed large cap stocks than less developed ones). To solve this issue, we have divided the data into market cap deciles by country (Figure 1.3).
The coverage ratio of stocks in the US remains at >90% right down to the 5th decile and drops off slowly thereafter. Bangladesh, Pakistan, Indonesia and Vietnam are the countries with most stocks (even larger ones) which remain completely uncovered. In most Asian countries, there are low coverage levels at the eighth decile and below; the exceptions are Australasia, and notably India.
There are clearly various potential weaknesses with this approach to analysing market inefficiencies, not least potential issues with data availability and accuracy. Also, just because there is a sell-side analyst covering a stock, it doesn’t mean that the quality of analysis is any good (or even human)! Nevertheless, we believe that it is sound to conclude that coverage levels in Asia are low. Furthermore, we think they are unlikely to increase any time soon.
Why is this important? Less coverage means fewer eyes watching a stock, and so more market inefficiencies. Wherever there are inefficiencies, there should be opportunities!
In a nutshell, this is why we choose to take the road less travelled and spend time and energy visiting the under-researched and under-rated companies of Asia.
Thank you for reading.
Andrew Limond, Romain Rigby
The original source material has been edited for spelling, punctuation, grammar and clarity. Photographs, illustrations, diagrams and references have been updated to ensure relevance. Copies of the original quarterly letter source material are available to investors on request.
For a demonstration of how stock market returns are driven by a handful of ‘right tail’ outperformers, see the Panah Fund letter to investors for Q4 2019 and the following Seraya Insight: ‘2020 Vision: Investing for the Last Decade & the Next’.
In recent years, the media has embraced an attitude of Schadenfreude towards active underperformance. For our own contribution to the active vs passive debate, see the Panah Fund letter to investors for Q2 2017 and the following Seraya Insight: ‘Passive Aggressive’.
The dataset covers all common stocks and depository receipts with a market cap greater than US $25mn (excluding REITS) listed on major exchanges in each country (excluding US OTC markets). It encompasses 18,260 stocks in Asia and 7,149 in the US, Canada and Europe. All data is from Bloomberg (Jan 2020).


