2020 Vision: Investing for the Last Decade & the Next
The best and worst Asian stocks over the last 10-20 years and the extreme right tail distribution of stock returns
This Insight is not investment advice and should not be construed as such. Past performance is not predictive of future results. Fund(s) managed by Seraya Investment may be long or short securities mentioned in this Insight. Any resemblance of people or companies mentioned in this Insight to real entities is purely coincidental. Our full Disclaimer can be found here.
This Insight is an extract adapted from the Panah Fund letter to investors for Q4 2019.1
What do the following stocks all have in common: an Australian gold miner, an Indian fisheries company, a New Zealand specialist dairy firm, an Australian PCB-design software house, a Hong Kong-listed smartphone lens-module maker, an Indian diversified financial services company, and a Japanese e-commerce platform specialising in industrial products?
Full marks for those who guessed that these were the best-performing stocks in Asia over the last ten years,2 with total US-Dollar returns ranging from ~8,000% to ~36,500% (i.e., compound annual returns of 55%-80%).
Any investor who bought US $100,000 of shares in top Asian performer Northern Star (an Aussie gold miner) at end-December 2009 would have been richer to the tune of $36.4mn by the turn of the following decade, provided they resisted the temptation to take profits.3

TABLE OF CONTENTS
Asia’s Best and Worst Performers over the Last 10-20 Years
A variety of other companies rounded out the top 50 for the last ten years, and all of them returned more than >2,000% over the period. In terms of geographical breakdown, some might be surprised to hear that 20 of top 50 companies were Japanese, 11 were from India, and only one was from Hong Kong or China.4 Australia and Thailand both did well relative to the size of their markets, contributing four names each to the top 50.
Software and internet companies were well represented in the top 50 with six names, although they did not dominate. Only one semiconductor company made the cut (an equipment maker). Other sectors contributions of note included eight retailers, three apparel makers, four food companies, and five financial firms. In other words, a fairly diverse bunch.
Of course, it’s arbitrary to draw a line at just 50 companies among Asia’s ~18,000 listed stocks.5 Broadening the sample size to examine the geographical breakdown of the top 100 Asian performers over the last decade shows that Japan still accounted for a hefty 34% of the total, India was steady at 21%, the China-HK proportion had increased to 11% (still low), while Taiwan contributed 9%.
The top 100 were also well-diversified by sector, but with a relatively strong contribution over the decade from consumer discretionary and consumer staples companies versus the regional index,6 and a relatively weak contribution from financial companies and tech firms.
As many as half of the worst 100 performers over the last ten years were from HK-China, mostly made up of a motley assortment of ‘metal-bashers’ (i.e., industrial metal- and coal-mining companies, iron and steel plants, engineering & constructions companies, and heavy industrials).
Similar companies in Japan and Korea were also adversely affected by the change in China’s economic growth model, and shipping companies in all three of these markets performed badly. A handful of Japanese utilities also fell precipitously over the decade following the Fukushima nuclear accident and shutdown of the country’s nuclear power generating capacity.
Examining stock returns over any given ten-year period is of course also somewhat arbitrary. The last decade might also be seen as particularly ‘unrepresentative’, as it didn’t include any major global economic recession or market crash (with the possible exception of the Euro Crisis at the beginning of the period, as well as periodic Chinese credit cycle-induced slowdowns). The previous decades contained many more ‘market events’, including the Great Financial Crisis (‘GFC’) in 2008, the Dotcom Bust in the early 2000s and the rolling Emerging Market and Asian Crises of the 1990s.
This is relevant, as even among the top performers we note the presence of several companies with suspect accounting, or what we judge to be unsustainable or speculative business models that probably wouldn’t survive the ‘margin call’ of a major market downturn (at least not in their current form).
When looking at the longer timeframe of two decades, it is interesting to note that 46% of the top 100 and 60% of the top 50 total return performers7 were from India. Two Indian finance firms led the pack, and indeed Indian financials have contributed 12% of the top 100 performers in Asia over the last two decades. Various Indian auto firms and other consumer companies also performed well.
Other honourable mentions over 20 years include three Thai hospital companies in the top 50. On the other hand, the paucity of Chinese companies in the top 50 is notable, other than a couple of cement makers and a consumer appliance company. However, an external beneficiary of China’s rise ranks at #2, the Australian miner Fortescue which supplied China’s insatiable demand for iron ore. Just 2% of the top performers over the last two decades came from Japan.
On a 15-yr time horizon, Chinese companies were better represented in the top total return performers, taking 21 of the 100 slots (compared to India with 27%). Tencent emerges at #3 (+150,495%), as do several Chinese consumer firms (including liquor companies) and a handful of pharmaceutical and healthcare firms. New Zealand specialist dairy company A2 Milk (which also sells milk to Chinese consumers) is also in the top 50. Japan accounted for just 4% of the top 100 performers over the last 15 years, with an even contribution from other Asian markets.
Consumer companies feature heavily in the top 100 over the last 15 and 20 years, accounting for 50% and 45% over these respective periods. In particular, consumer staples companies dominated the top performers table (relative to their smaller weight in the index). One surmises that this has been driven by investors in search of steadily growing cash flow and dividends amid the increasingly accommodative monetary policy environment of the last two decades.
In contrast, only a handful of tech companies and non-Indian financials made the cut over the last two decades, likely because of high starting valuations in tech (thanks to the Dotcom Bubble), and the levelling effect of the GFC in 2008.
A reasonable proportion of the worst 100 performers over the last 15 and 20 years came from Japan. Financial companies across Asia performed poorly over both time periods (especially Japan), thanks to the GFC. Over a 20-year period, tech, telecom and other communications firms also contributed a fair chunk of the losers (probably owing to high starting valuations in the Dotcom Bubble).
Investing with 2020 Hindsight
It is notable how specific countries dominate the top and bottom performance tables during certain time periods. Indian stocks were the massive outperformers over the last two decades, Chinese firms did well over a 15-year time horizon, while Japan was the ‘surprise’ outperformer during the last decade. In that sense, macro and market factors do matter.8
Of course, it also helps to have a large domestic market with plenty of listed stocks from which to pick the winners (and losers) – something which India, China and Japan all enjoy, as each country has ~3,000 listed stocks. Moreover, it also helps to have a healthy small cap market, as most of the big winners started very small.
The massive outperformance from Indian stocks came early, in the years 2003-2007, when the Indian market rose six-fold as GDP and earnings growth accelerated and stocks rerated. Perhaps China’s nascent consumer economy of the last ten years will provide more fertile soil for the growth of companies with ‘better business models’.
Some might be surprised to see such a strong showing from stocks in ‘ex-growth’ Japan during the last ten years. The explanation is probably a mix of factors: a large and diverse economy; lots of listed stocks; high levels of market inefficiency (i.e., low analyst coverage); very low starting valuations; a positive corporate governance tailwind; and extremely stimulative monetary policy from April 2013 (including stock purchases by the central bank).
With perfect 2020 hindsight, one should have bought consumer companies and Indian financials two decades ago, then diversified into more Chinese consumer stocks around the time of the GFC, and finally rotated into cheap Japanese franchises just prior to the Bank of Japan’s adoption of quantitative easing (‘QE’) in 2013. Tech and communications stocks were best avoided for around a decade following the Dotcom Crash, as were Japanese financials and industrials companies. After 2011, the key call was to avoid most companies geared to Chinese industrial overinvestment as supply-side gluts wreaked their havoc.
While such ex-post evaluations might be interesting, they provide little guidance for the next decade. For future guidance, we must dig deeper.

The Distribution of Stock Returns
Other than fantasising about what stocks or markets we might have bought ten or twenty years ago, are there any lessons to be learnt here? Indeed, does it even make sense to look at extreme stock outperformers?
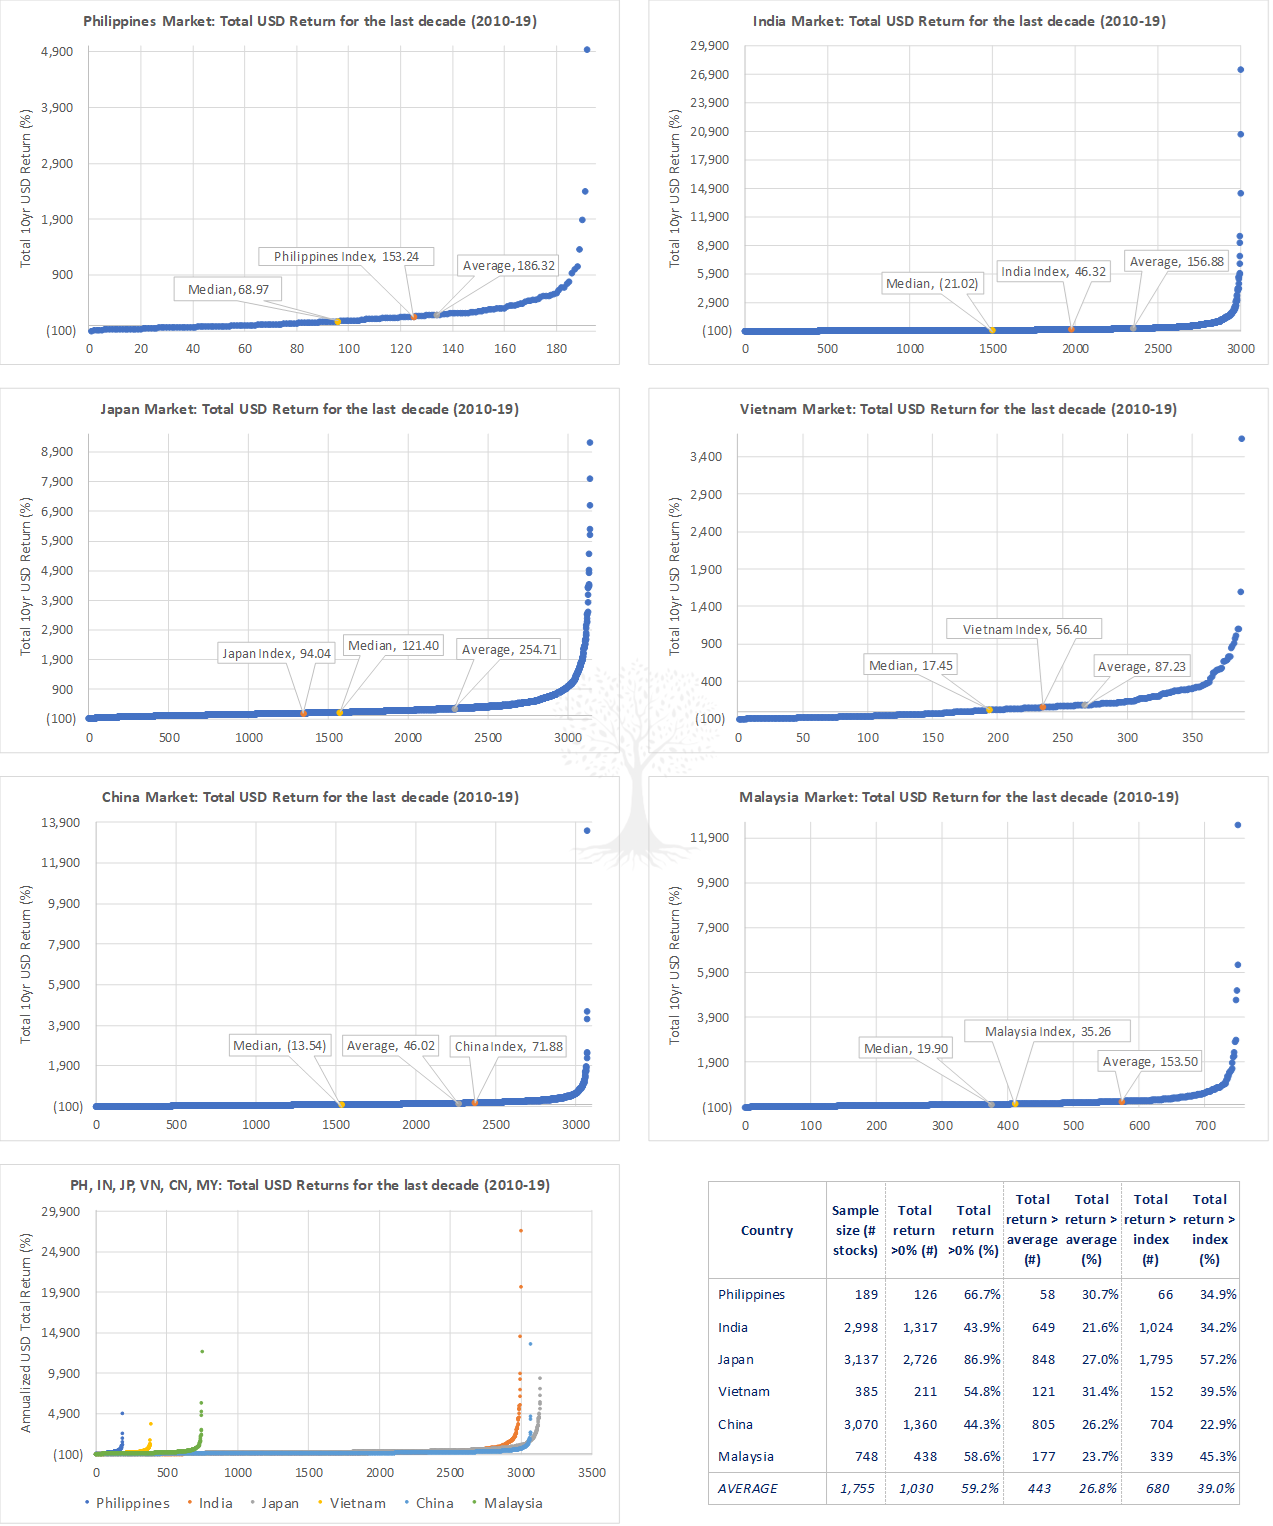
If one examines the distribution of total return performance data over the last decade, then a striking phenomenon quickly becomes clear. That is, there is an extreme right tail distribution to stock returns. In other words, a tiny proportion of stocks in each Asian country under consideration drove market returns over the period (Figure 3).9

Indeed, on average only ~27% of stocks in the six markets managed to outperform the equal-weighted average performance of each respective market. In India, as many as 78% of the ~3,000 stocks under consideration underperformed the average Indian total return for the decade.
In summary, the extreme outperformance of a handful of stocks dragged up the average total return, while median total return lagged massively. This led to a pronounced skewness in returns.
In most cases, the performance of the relevant country index lay somewhere between average and median total performance. Only in China did the relevant index manage to outperform the market average thanks to index overweights in several mega-cap outperformers such as Tencent. In Japan, the median stock outperformed the index as cheap small-cap stocks finally caught a bid.
In a relatively strong decade for equity returns that saw no major setbacks, a surprisingly large number of stocks in India and China (~56% in both markets) made negative total returns during the period. In Japan, on the other hand, the rising tide of monetary policy lifted almost all boats (as ~87% of stocks made a positive return).
For all the Asian countries we examined, only a single-digit percentage of stocks made a compound return in excess of 20% per annum (i.e., a total return of ~619% after ten years); this ranged from just ~2% of all stocks in China over the decade, to a more respectable ~9% in Japan.
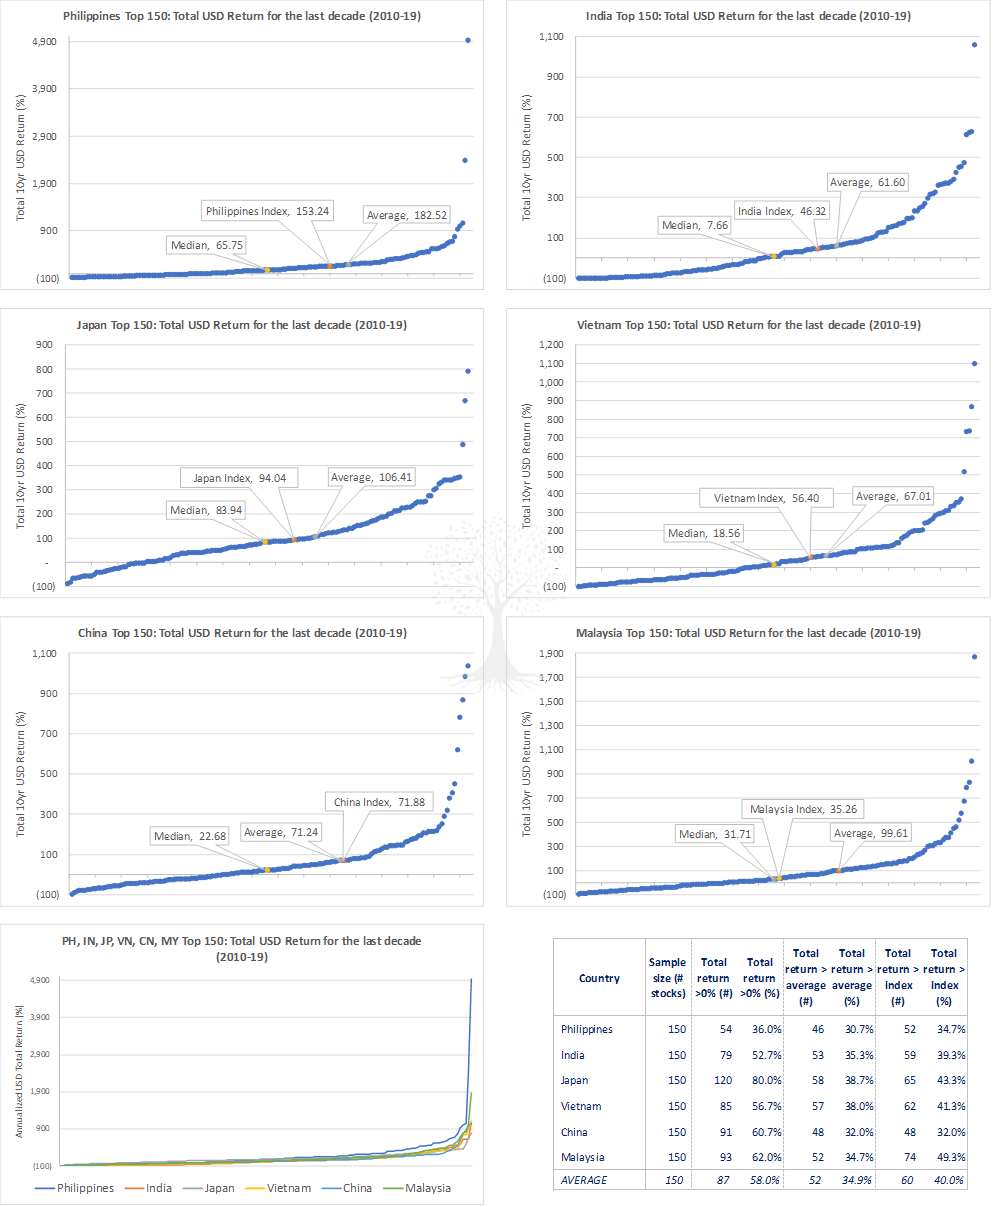
Sceptics might note that many of the total return of the very top performers would have been so small as to be effectively uninvestable one decade ago. We thus recut the data to consider the decade total return for only the top 150 largest stocks in each market ten years ago (Figure 4).10

The results showed a similar pattern, with the only major variation being the degree of outperformance of the extreme right tail. In each of the markets under consideration, more than 60% of the top 150 stocks underperformed their equal-weighted average during the period. In most markets, just <3.5% of the top 150 made a compound return in excess of 20% per annum.
To what extent can our findings be extrapolated to other markets and time periods?
It is interesting to note that our conclusions echo another long-term study on US stock performance published by Professor Henrik Bessembinder in 2018. This suggests that the extreme skewness which appears in our data may well be a common phenomenon across equity markets.
Professor Bessembinder analysed monthly common stock returns for the years 1926-2015. He found that only 47.8% of stocks produced returns larger than the one-month Treasury rate in the same month, and more than half made negative returns.
Moreover, “When stated in terms of lifetime dollar wealth creation, the best-performing 4% of listed companies explain the net gain for the entire US stock market since 1926, as other stocks collectively matched Treasury bills.” Of the ~26,000 stocks in the database, only 90 of the top performers (i.e., less than one-third of one percent), were collectively responsible for more half of the wealth created during the period. In summary, “the positive mean excess returns observed for broad equity portfolios are attributable to relatively few stocks”.
Part of the problem was that the median time that a stock was listed in the database from 1926 to 2016 was just seven-and-a-half years. He concluded, “These results highlight the important role of positive skewness in the distribution of individual stock returns, attributable to skewness in monthly returns and to the effects of compounding. The results help to explain why poorly diversified active strategies most often underperform market averages.”
In other words, if you’re going to pick stocks, make sure you avoid the losers, and instead overweight the very small proportion of winners that drive market returns!
The implication is that investors should reject the majority of investment opportunities that come their way. If investors are able to avoid the losers which make a zero percent return or worse, then that is already a positive first step. So much the better if one can find a few stocks which fall in the skewed right tail of top echelon returns! These findings appear to support the adage that you should cut your losers and let your winners run.
In practice, of course it is extremely difficult to find and hold the best ‘compounder’ companies. There are many important factors to consider, although the most important is no doubt to identify a strong growth tailwind that will enable a company to compound returns over the long-term.
Valuation is also important, not least because a rerating uplift can contribute substantially to returns. Other relevant factors include: barriers-to-entry; company profitability (not all businesses are created equal); ability to reinvest capital at a high rate of return; management ability (especially regarding capital allocation); and corporate governance.
While most investors cannot reasonably expect to pick all – or even any – of the top 100 stocks in the next decade, we believe it is still possible to achieve outperformance by aiming for companies which are more likely to sit in the positive right-tail of the return distribution.

In future missives, we plan to consider some of the more prospective areas where we think investors are more likely to find the compounders of tomorrow.
Thank you for reading.
Andrew Limond, Romain Rigby
The original source material has been edited for spelling, punctuation, grammar and clarity. Photographs, illustrations, diagrams and references have been updated to ensure relevance. Copies of the original quarterly letter source material are available to investors on request.
These were the best performing stocks in Asia last decade according to the following definition: total return in USD during the period 1 Jan 2010 to 31 Dec 2019, for Asian stocks with an ending market cap of US >$1bn. Note that there was no filter employed for minimum market cap as of the start date. Data (sourced from Bloomberg) was adjusted manually to exclude non-continuous and reverse listings.
An investor would have been even better off, if he or she had the foresight to reinvest all dividends received.
As defined by each stock’s ‘country-of-risk’ classification.
There are ~18,000 stocks in Asia with a market cap greater than US $25mn.
We have compared the sector classification of last decade’s top 100 Asian stocks of US >$1bn market cap (at the end of the period) versus the sector weightings of the regional index (USD) at end-December 2019.
With a market capitalisation of US >$1bn or more at end-Dec 2019.
For more information on the relevance of macro, please see the Panah Fund quarterly letter to investors for Q2 2019 (pp.4-15) and the following Seraya Insight ‘Why invest in Asia? A Fundamental Look at the Drivers of Growth and Stock Returns in Asia since 1960’. The evidence suggests that strong nominal export growth in USD-terms is correlated to high market returns over multi-decade periods, and the liberalisation of real estate collateral is also linked to higher nominal GDP growth and equity returns. Increases in credit growth and penetration can also drive equity returns over shorter time periods.
We examined the total return data for all available listed stock total returns for the decade 2010-2019 in the following Asian markets: heavyweights China, India, Japan, alongside smaller SE Asian markets Malaysia, the Philippines and Vietnam. Total returns were only calculated for those stocks which were already listed by 31 December 2009; more recent IPOs were not included in the data.


