Why invest in Asia? A Fundamental Look at the Drivers of Growth and Stock Returns in Asia since 1960
An examination of which Asian countries have got rich over the last ~50 years and how – the importance of export manufacturing for wealth creation
This Insight is not investment advice and should not be construed as such. Past performance is not predictive of future results. Fund(s) managed by Seraya Investment may be long or short securities mentioned in this Insight. Any resemblance of people or companies mentioned in this Insight to real entities is purely coincidental. Our full Disclaimer can be found here.
This Insight is an extract adapted from the Panah Fund letter to investors for Q2 2019.1
Why invest in Asian equities? This might seem like a strange question for an Asian-focused fund manager to pose. However, given the current lack of general enthusiasm for Asian stocks, as well as the lacklustre performance of Asian equities over the last decade, it is not an unreasonable question to ask.2
Since the establishment of the Panah Fund almost six years ago, the Bloomberg Asia Large, Mid & Small Cap Price Index (‘ASIALS’) has returned just ~25% in US Dollar-terms.3 On an annualised basis, this equates to returns of less than ~4%. In other words, Asian equity price returns have only just kept pace with inflation during the period.
Since I first started working in Asian fund management 12 years ago, Asian price returns have been even worse: less than ~17% for ASIALS (an annualised return of less than ~1.3% over the period).
Of course, the picture does look slightly better if one incorporates dividends into index returns: the Bloomberg Asia Large, Mid & Small Cap Total Return Index (‘ASIALST’) has returned ~51% since mid-2007. This provides a valuable demonstration of why it makes sense to reinvest dividends over the long run.
Even with dividends reinvested, however, this means annualised US-Dollar returns for ‘high growth’ Asia have been poor for the last 12 years: just ~3.5% (for ASIALST). Such returns are certainly not enough to compensate investors for the risk they have been taking in equities rather than bonds.
In hindsight, in mid-2007 investors would have been far better off putting their money in US 30-year Treasuries, which at the time were yielding ~5.3% (as they would have enjoyed both substantial capital gains from this position, as well as a juicy yield!).
Even better if investors had possessed the foresight to invest in US equities at that juncture: despite the Great Financial Crisis, the S&P 500 has risen +96% over the last 12 years, while the NASDAQ 100 has gained +297%.
While some readers might take issue with the somewhat arbitrary timeframes which we have employed to demonstrate Asia’s lacklustre track-record, it is difficult to deny that regional equity indices have produced disappointing returns for investors over a substantial period of time.
This is despite robust economic growth for the region over the same period: annual real GDP growth in Emerging Asia has averaged ~7.4% since end-2007, and 8.1% since end-1999.4
So, if real GDP growth cannot be relied upon to drive equity returns, what does matter? This question has profound implications for investors, as it goes to the heart of what generates economic growth and equity returns. It also helps to address the question why and how one should invest in Asian equities.
TABLE OF CONTENTS
What Drives Equity Returns in Developing Economies?
Most investors are familiar with the standard ‘cut-and-paste’ bull case for Asian (and Emerging Markets) equities, which goes something like this…
“Asia is the fastest-growing, most dynamic region in the world, with one-third of global GDP and more than half the world’s population. By 2050, Asia will account for more than half of global GDP. The growth will be driven by rapid population growth and rabid consumption from a swelling middle class. Household debt levels will rise from current low levels to underpin this robust domestic consumption. Infrastructure investment will rise as urbanisation levels increase further. The economic centre of gravity of the world will continue to shift eastwards. The 21st century belongs to Asia!”
XYZ Capital Management5
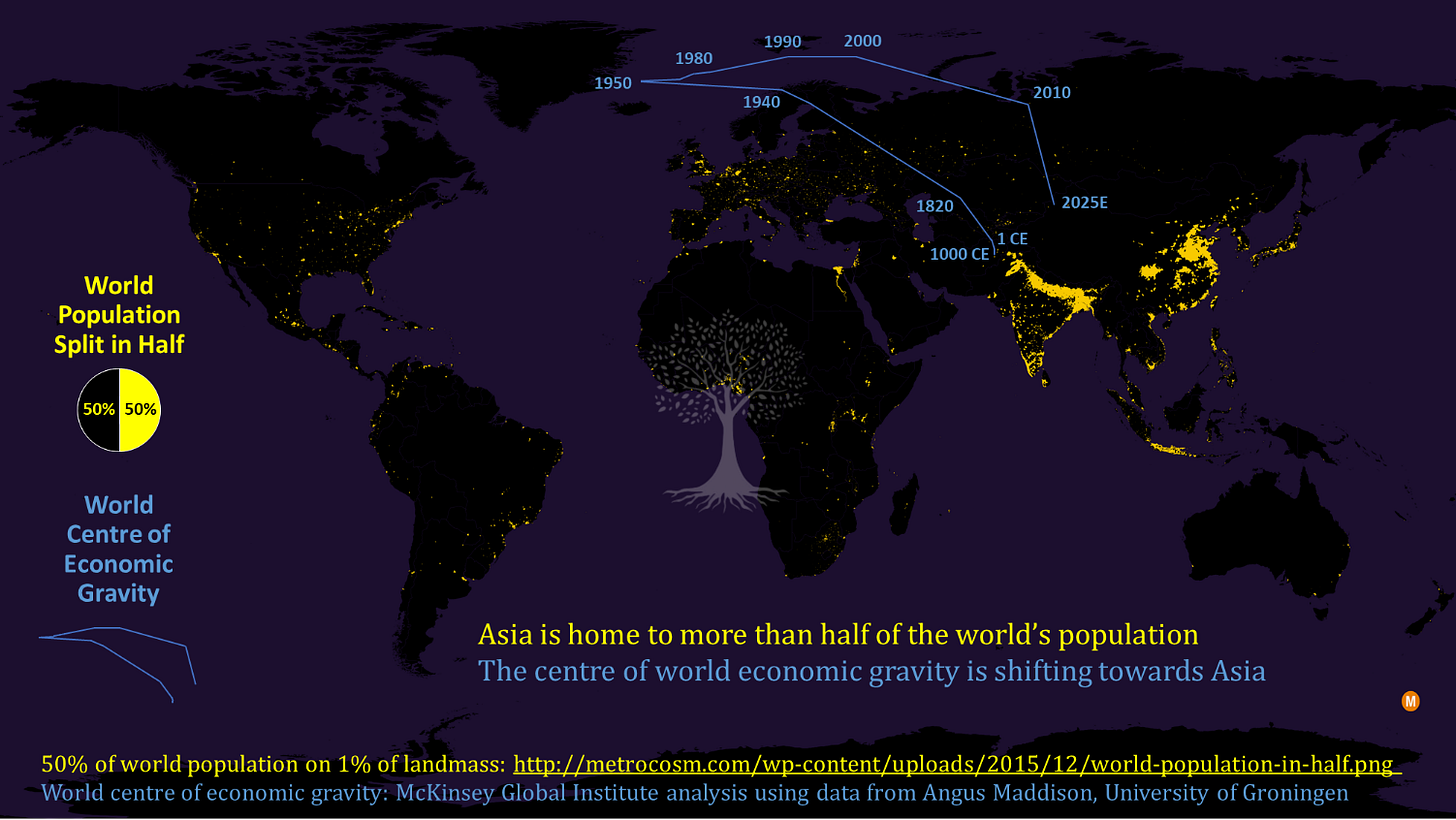
This is a narrative driven by population growth, increasing wealth, consumption growth and GDP growth, which will together propel Asia towards a bright future. Indeed, the ‘Asia story’ makes for good press and allows for the creation of some impressive charts and graphics (Figure 1).
The ‘demographics as destiny’ and ‘consumption calling’ story, however, glosses over a very important point: is it really population growth, consumption and real GDP growth which drive equity returns? Let’s consider each of these in turn.
At first glance, it might seem self-evident that population growth should boost consumption and GDP, which will inevitably drive increases in the market value of consumer companies. On further examination, however, the reality is more complicated.
Population growth may seem like a positive force, but is really a double-edged sword. Rapidly increasing populations compete for limited resources, and this is just as likely to create conflict as to boost growth.
This is perhaps best illustrated by the apocryphal story of the presidents of two anonymous nations who are both scheduled to speak at a global conference on demographics. The first president ascends the podium to speak: “My nation has a fantastic demographic profile! A large proportion of the population is aged between 15-35, and many workers have moved from the countryside to urban areas, to fill the new factories in our rapidly growing manufacturing sector.”
The audience applauds and the president of the second country stands to speak: “My nation has very challenging demographics. There are many young people between the ages of 15-35, and not enough jobs for them all. They move to the cities and live in shantytowns with no running water or sanitation. We worry about growing poverty, environmental pressure, and the rising appeal of extremist ideologies.” The demographics of these two nations may be similar, but their situations are very different.
Consumption dominates the GDP contribution of most developed economies. It is thus tempting to assume that consumption has helped drive these nations to rich-country status, and that developing countries should aspire to follow the same path. As we shall see, however, for developing nations, consumption alone is not the key to wealth. Indeed, consumption in the wrong context and to an excessive degree can be extremely destabilising for developing economies.
What about real GDP growth,6 surely there must be a link with equity returns? While this might seem self-evident, unfortunately it is also untrue.7 A growing corpus of academic studies shows no link, or even a negative correlation between real GDP growth and equity returns in both Developed and Emerging Markets over the course of many decades of stock market history.8
So, what does drive equity returns? In this letter, we will attempt to show that it is the successful adoption of the ‘export-led growth model’ which has allowed a handful of developing countries to claw their way up towards developed country status, in the process generating tremendous nominal GDP growth, revenue increases, and equity returns.
We will also show which countries have managed to accomplish this, and which economies stand the best chance of doing so in the near future. Unsurprisingly, almost all of them are in Asia.
The ‘Equity Returns Matrix’
The first step we will take in this journey is to establish that there is in fact a link between GDP growth and equity returns.
Rather than using real GDP growth in local currency terms, however, it makes more sense to consider the link between equity returns and nominal GDP growth in US Dollar terms. After all, stock prices are stated in nominal terms, inflation metrics and deflators can be unreliable, and the greenback is still the basic international unit of account.9
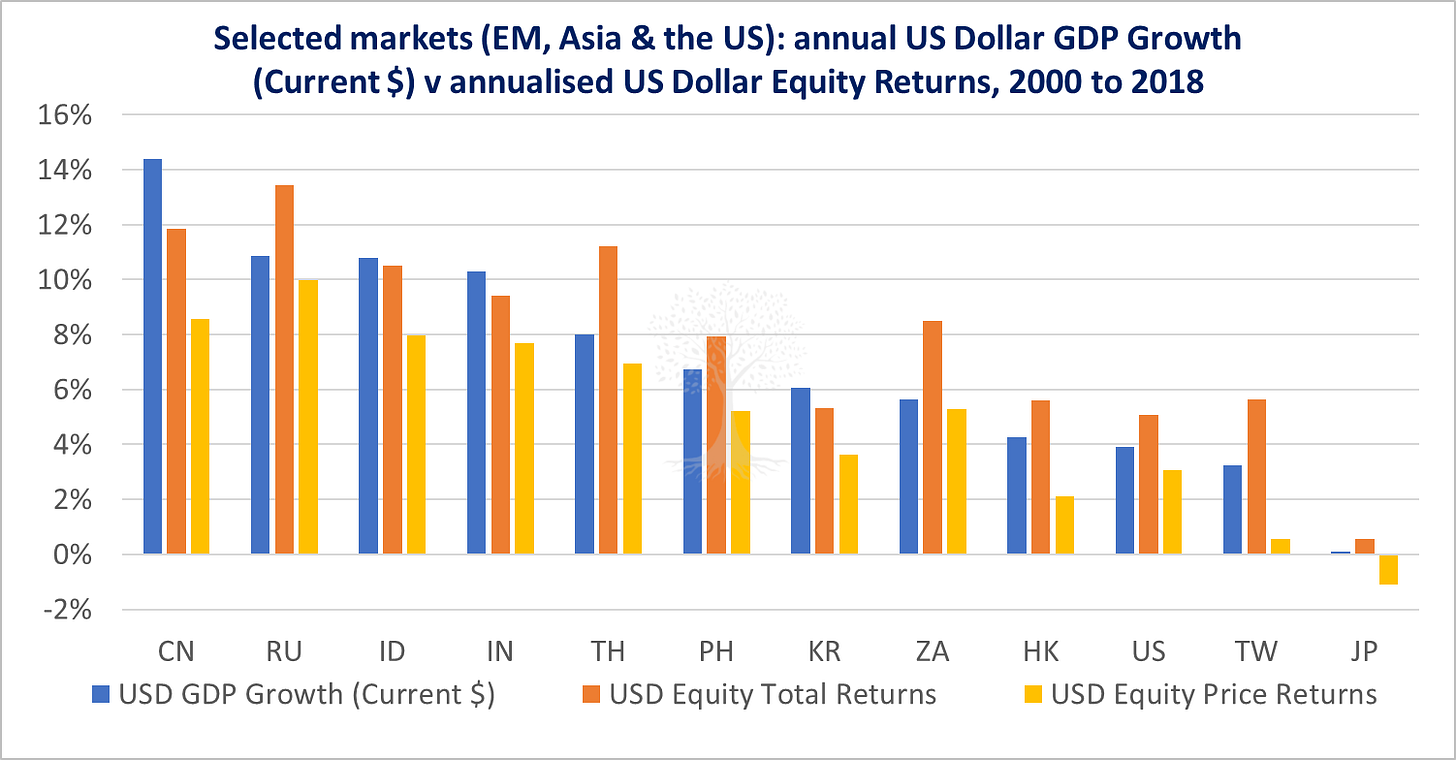
When we plot US Dollar nominal GDP growth for various Asian and EM countries during the period 2000 to mid-2019 against USD equity returns over the same period, a relationship emerges (Figure 2).
So far so good, but why should USD nominal GDP growth be linked to equity returns? To answer this question, we break down the concept of equity returns into a ‘matrix’ of several variables:
First comes the intuitive link between nominal GDP growth (i.e., economic output) and revenue growth for the entire corporate sector (as most investors know, it is harder for companies to grow over the long run without a tailwind from steady top-line increases);10
Raw material prices and direct labour costs then determine gross margins;
Sales, administrative and other costs affect operating profits;
Interest costs and tax rates impact net profits;
Share issuance (or buybacks) have a direct bearing on the share count, and thus investors’ share of earnings; and,
The valuation multiple applied to these earnings is affected by even more factors, including expectations for future growth, domestic liquidity and credit growth, local investment preferences (i.e., risk aversion), corporate governance, and even the structure of the financial system in the country in which the stock is listed (e.g., market development, presence of institutional investors, openness of the capital account, etc.). Moreover, earnings multiples can fluctuate wildly over brief time periods.
Given the multiple complex variables in this ‘equity returns matrix’, no wonder that it is effectively impossible to predict equity returns in the short-run!11
It is beyond the scope of this missive to consider all of these topics (otherwise, this letter would quickly become a book). Instead, we will focus on the key point that nominal GDP in US Dollar terms drives revenue growth for the corporate sector, which in turn is a major determinant of long-term equity returns.
Our preferred methodology is to take the empirical approach, diving into the data to examine which countries have managed to get rich quick, and then asking how they have done so.
Which Poor Countries Have Become Richer, and How?
After World War II, Asia consisted almost entirely of less developed nations.12 Since that time, a handful of countries have managed to generate a massive amount of wealth while others have lagged. It is possible to capture this contrast in a single chart (Figure 3), which compares each nation’s US Dollar nominal GDP per capita relative to the US at two points in time, 1960 and 2016.13
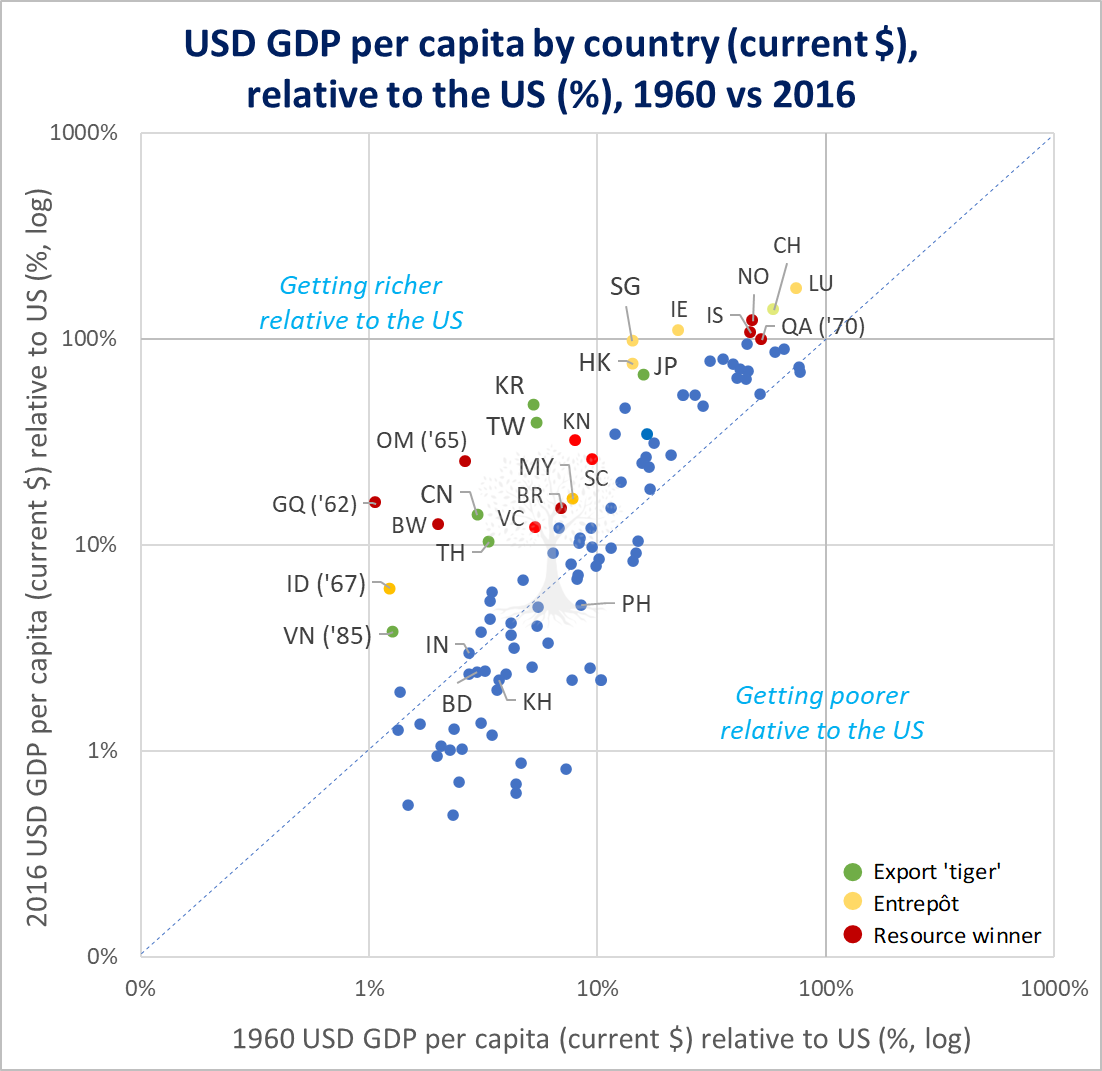
Countries located above and to the left of the dotted line (Figure 3) have managed to improve their position relative to the US; those who sit below and right of the line have gone backwards.
Amid the chaos of the left-hand scatter plot, a pattern emerges. Let’s divide those countries which have most improved their lot during the 1960-2016 period into three categories:
The Asian ‘export tigers’ (green), which have rapidly grown their wealth primarily by relying on the export of manufactured goods – Korea, Taiwan, China (and to a lesser extent Thailand and Vietnam);
The ‘entrepôts’ (yellow), where growth has perhaps been partly driven by manufacturing, but with a additional strong contribution from the provision of trade and financial services – Hong Kong and Singapore, and perhaps also Luxembourg and Ireland (the ‘Celtic Tiger’);14 and,
The resource winners (red), which have driven growth for their small populations by leveraging their natural resource endowments, including hydrocarbons (Equatorial Guinea, Oman, Norway, Qatar), diamonds (Botswana), fish (Iceland), and beaches (the Seychelles and some Caribbean islands).
This pattern is not perfect, as some countries have been successful exporters of commodities and manufactured goods, so fall between categories (e.g., Malaysia, Indonesia). Clearly, the picture is also far more complex for more developed economies.
Nevertheless, this analysis seems to tell a consistent story about how poor countries have managed to become richer. In one word: exports.
Leaving aside those resource winners with small populations which have been lucky enough to strike gold (literally or metaphorically),15 we can see that the most effective growth model for a poor but ambitious country is to become either an export-manufacturing ‘tiger’ economy, or one of the entrepôts which services the ‘export tigers’ and the other countries around them.16
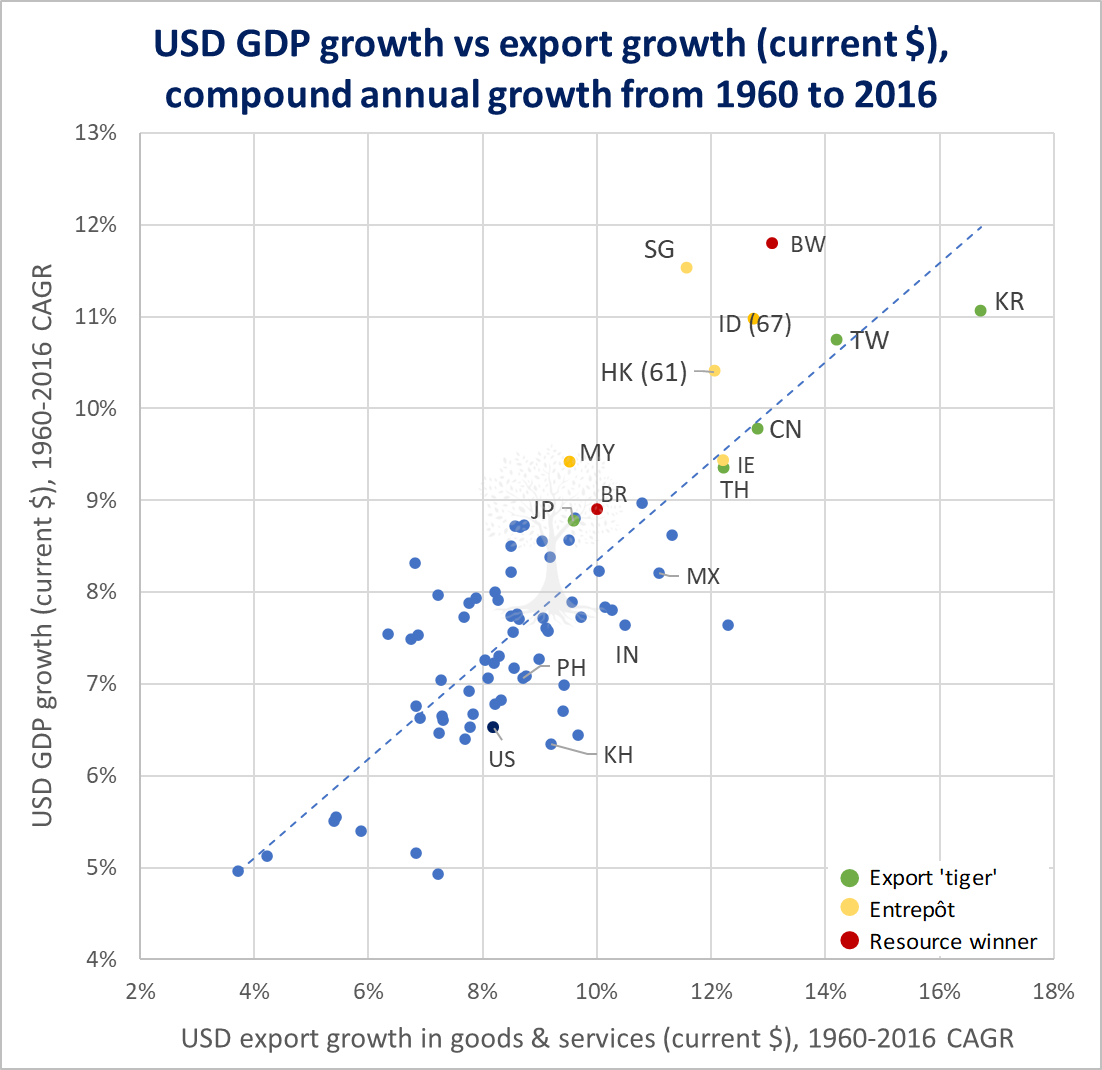
This point is driven home when examining which countries in the world have managed to grow the most rapidly in absolute US Dollar terms since 1960.17 Unsurprisingly, we see a strong relationship between aggregate US Dollar nominal GDP growth and export growth (Figure 4). The stand-out export-growth machines are the original ‘Asian Tigers’ – Korea, Taiwan, Singapore and Hong Kong – as well as China. (Notable mentions also go to Botswana, Indonesia, Ireland and Thailand.)18
This is the story of manufacturing in special economic zones, foreign direct investment (‘FDI’), mass employment in factories (as governments make effective use of the country’s demographic dividend), rising education levels, urbanisation, and a relentless scramble up the manufacturing value chain from textiles to plastic trinkets to electronics and other light industrial products,19 accumulating technological know-how along the way.
It needs a lot of things to go right for a country to be able to grow exports at a rapid pace. It helps if a country is located near to existing export supply chains (i.e., proximity to market). The government of the day has to take extremely difficult decisions that will likely not pay off for many years in the future.20
Why Do Exports Matter?
Exports would appear to be the mysterious common denominator between all countries which have managed to grow sustainably at a rapid pace over the last ~65 years.
Given that many of these countries are located in Asia, it is perhaps unsurprising to see that Asia’s US Dollar nominal GDP growth is strongly related to export growth (Figure 5). But why do exports matter so much?
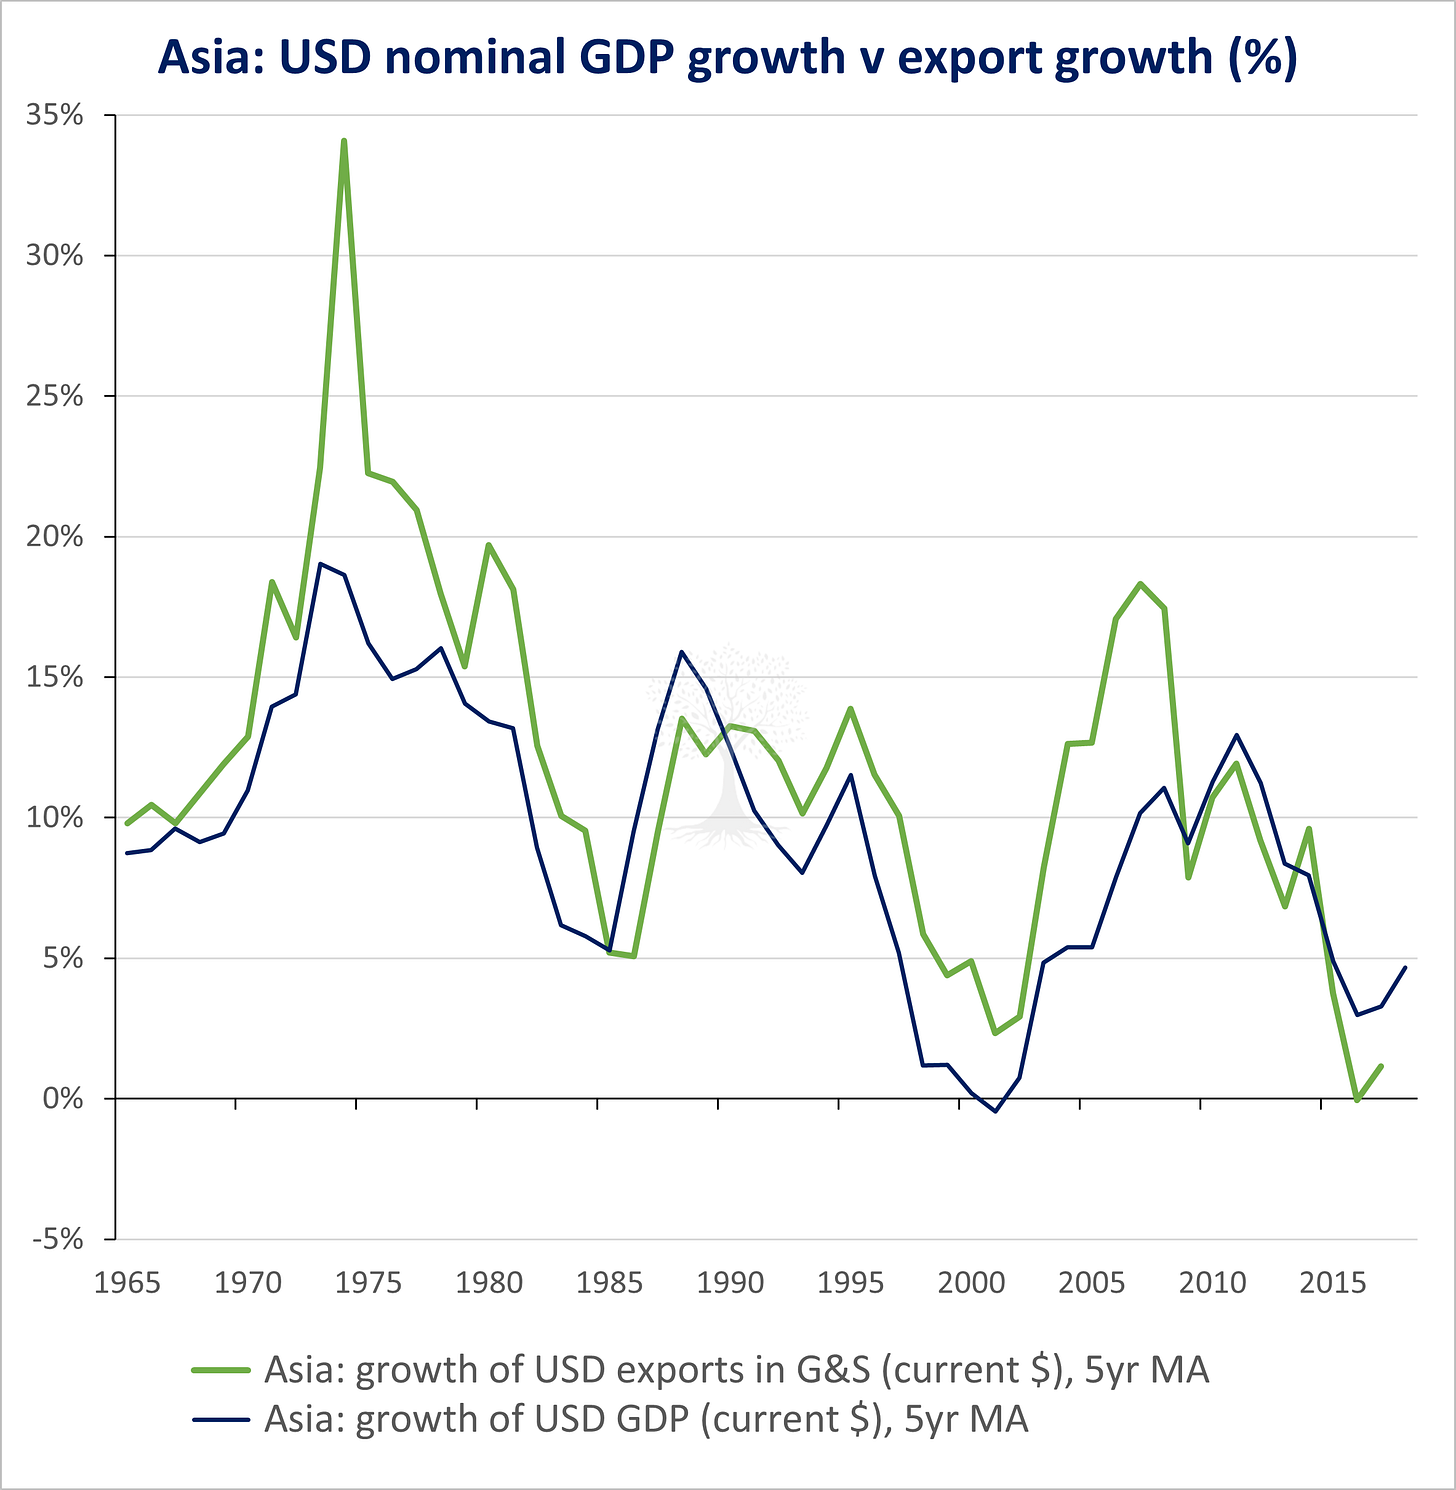
Obviously, net exports make a direct contribution to GDP.21 This direct arithmetic contribution, however, understates the role that exports play in the industrialisation process.22
There are clearly various other reasons that exports are so import for driving growth:
Strong export growth means high profits for exporter firms and employment for their workers, leading to higher rates of saving and investment.
Technology transfers in the export sector generate substantial productivity growth, as does the movement of workers from inefficient rural labour to modern factories.
A country with a strong export base can grow its GDP in US Dollar terms. This is because the exporter can afford to import more goods and services (including machinery for factories and goods for consumption) without creating a trade and current account imbalance, and thus without putting unintended pressure on the local currency. This helps exporter economies to grow without experiencing any debilitating currency crises.23
Note that Emerging and Frontier Markets are littered with examples of countries which have tried to grow domestic demand at a rapid pace without a strong export base.
Ironically, one of the classic signs of trouble is actually strong domestic consumption, which is often accompanied by asset price appreciation as investors get excited about the nation’s growth trajectory. Nevertheless, if consumption is ‘running hot’ and is accompanied by widening external deficits, then reality soon catches up.
In such an economy, a consumption boom has typically sprouted amid loose credit and/or fiscal conditions. As consumption increases, import demand also outstrips the economy’s weak export base, which results in widening trade and current account deficits. This may be offset by capital inflows for a short time (i.e. portfolio flows and FDI).
When these inflows stop or reverse, however, then the result is usually rapid currency depreciation. This is typically followed by weaker growth (and asset price returns) as interest rates are hiked to choke off imprudent ‘overconsumption’. At present, Pakistan is a classic example of an Asian economy facing such issues.24
Converting Growth into Equity Returns: a China Case Study
Export powerhouse China is the most recent fully-fledged member of the Asian ‘export tigers’ club, and so shall serve as the primary case study in this report.
China experienced a turbulent boom-bust market during the 1990s. Challenging reforms implemented by Premier Zhu Rongji25 during that period culminated in China’s accession to the World Trade Organisation (‘WTO’) on 11 December 2001, which marked a new phase of China’s export-driven growth trajectory.
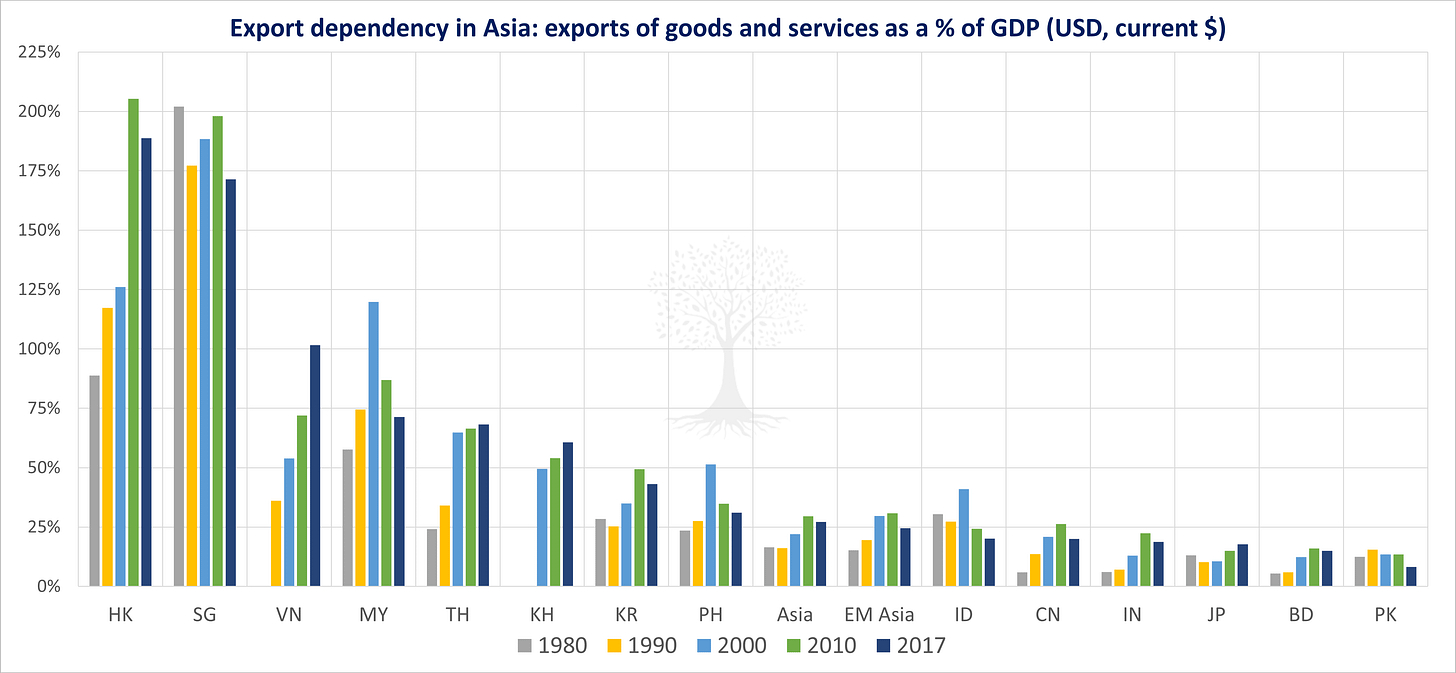
China’s export dependency (i.e., exports-to-GDP ratio) had already risen from ~6% in 1980 to ~20% by the year 2000. From WTO accession, however, it then took just 12 years for China’s exports to increase almost tenfold to US ~$2.4tn, making the country the largest exporter in the world.
It is also no coincidence that this period of rapid export growth corresponded with a brisk increase in China’s household savings rate, from a low of ~27% in 2002 to ~39% in 2010. This allowed the country to fund a massive program of investment, thus further supporting growth.

China’s export dependency ratio jumped from ~20% in 2000 to as high as ~36% in 2006. This period (the grey shaded areas in Figure 6) corresponded with a sharp acceleration in revenues and earnings per share (‘EPS’) for listed companies.26
Even as the exports-to-GDP ratio slipped after 2008, exports continued to increase in absolute US Dollar terms. Revenues and earnings also continued to grow, displaying signs that that a ‘virtuous cycle’ had taken hold.
Equity returns from the HSCEI also increased during 2002-2007, shooting up even faster than EPS given an uplift in valuation multiples over this period. The HSCEI price index fell (along with revenues and earnings) during the Great Financial Crisis, then rebounded with China’s aggressive fiscal stimulus into 2010.
Since that time, however, the HSCEI has drifted sideways even as revenues and earnings have doubled. This represents a marked derating, and just goes to show what a large impact that valuations can have on equity returns.
Does the same relationship between exports, revenues, earnings and equity returns hold for other countries?
As far as we can tell, yes. For instance, in the case of Korea and Taiwan, a ‘second round’ of rapid export dependence increases played out over a ~15 year period from the late 1990s to 2012 as both nations moved up the value chain to heavy industrial and high-tech manufacturing.27
Over that period, the export dependency ratio for both countries increased sharply (from ~25% to ~55% in the case of Korea, and from ~45% to ~73% for Taiwan). This period corresponded with strong revenue and earnings growth for both stock markets, as well as high equity returns.
India’s export dependency ratio rose from 13% to 25% during the period 2002-2014 as the country’s exports quintupled, driven by capital-intensive pharmaceutical and machinery exports (and to a lesser extent IT outsourcing). This marked a period of massive revenue and earnings increases for listed companies following several years of stagnation, with even higher equity returns as valuation multiples increased.
In recent years, however, India’s exports have flatlined and the country’s export dependency ratio has slipped to ~20%. This is a pity, as India has a large potential advantage in the form of a massive rural workforce that might be deployed in labour-intensive manufacturing.
It would require substantial political willpower in democratic India, however, for the government to implement the export-growth model which has been adopted with such great success in other more autocratic Asian nations. This does not seem likely anytime soon. Still, even as exports tread water, we see no immediate cause for concern.
Going forward, however, it would make sense to monitor India’s export competitiveness and be on the lookout for any current account deterioration, especially given expensive equity valuations.
Vietnam and Other New ‘Export Tiger Cubs’
Given the importance of exports for revenue and earnings growth, it seems important to ask whether any other countries in the world stand a chance of becoming the new ‘export tiger cubs’? For, if the historic pattern holds, it should be these economies which stand a high chance of generating outsized equity returns in the long run.
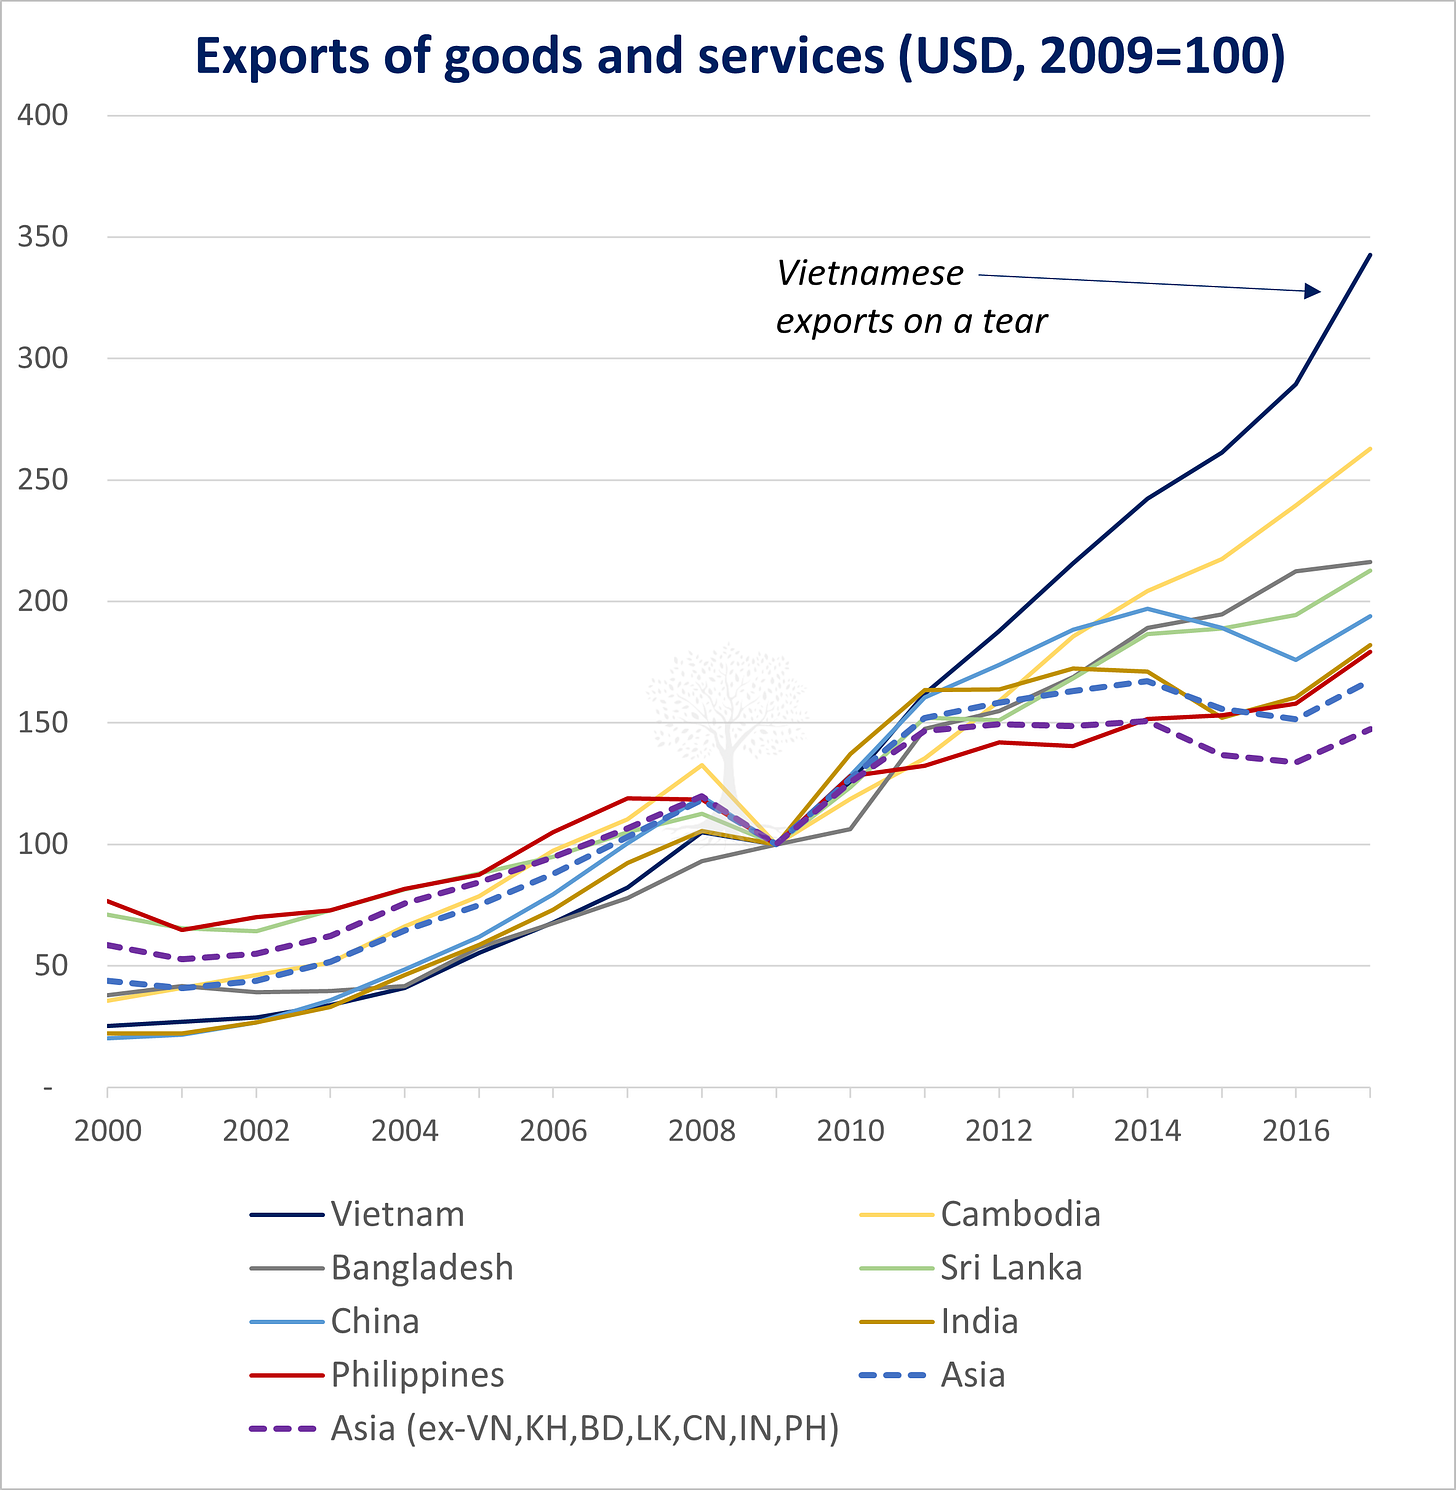
Panah investors will not be surprised to learn that Vietnam is the country which has comfortably posted the strongest export growth in the world over the last decade (Figure 7), driven by labour-intensive manufacturing of products such as textiles and electronics.28
This rapid growth has allowed Vietnam’s exports-to-GDP ratio to post an enormous and almost unprecedented increase over the last two decades, from ~50% of GDP in the year 2000 to >100% in 2017 (Figure 8). Other than the two trade entrepôts of Singapore and Hong Kong, Vietnam now has the highest export dependency ratio of any country in Asia.
Naturally, the absolute US Dollar value of Vietnam’s export numbers (US $233bn in 2018) pales into insignificance compared to China (US $2.65tn). Given Vietnam’s labour cost advantage and the gradual but positive reinforcing effect of supply chain clusters,29 however, it seems reasonable to expect that Vietnam will be able to further increase its global share of light industrial exports over the next decade, even as China’s share stagnates.30
Which other countries in the world are also becoming ‘export tiger cubs’?
Nipping at the heels of export-dynamo Vietnam are Cambodia and Bangladesh, which have also managed to grow exports at a rapid clip over the last decade (Figure 7). Of these two countries, Cambodia boasts the higher export dependency ratio of >60%, while the relevant Bangladeshi figure is still just ~15% (Figure 8); further reform and investment are required for Bangladesh to reach its potential.31
Of these three countries, Vietnam is currently the most investible, with ~750 listed companies boasting a combined market cap of US ~$150bn.32 Bangladesh has half the number of stocks, with a combined market market cap one-quarter of the size of Vietnam and a more limited free float. There are still only five stocks listed on the Cambodian domestic stock exchange.33
For most investors, Vietnam thus presents the most fertile hunting ground among the new ‘export tiger cubs’.
Risks to the Export Story
There are of course risks to the export story.
With the US-China Trade War in full swing, one major concern is an escalation in tensions. If the US were to take further measures to restrict Chinese access to advanced US technology (e.g., a ban on Huawei accessing American semiconductors and/or IP), then this would carry a real risk of delaying China’s ascent up the value chain towards heavy industrial and high-tech manufacturing. This would not only be disruptive to China’s long-term ambitions, but in the near-term may even cause a bifurcation in global supply chains.
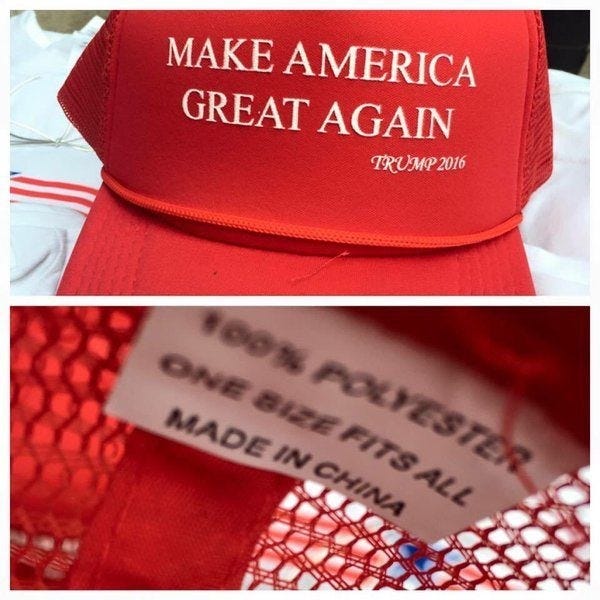
Such actions (or perhaps higher US tariffs on Chinese goods), would probably not, however, immediately cause a large swathe of China’s existing mid- to high-end export capacity to be shuttered, given the country’s embedded manufacturing and supply chain advantages.
Rising US-China tensions may persuade more companies to build future factories in Southeast Asia rather than in China. On balance, though, we think that any major outsourcing gains for Vietnam and other Southeast Asian nations may take time to emerge – perhaps only after the next global recession.
Indeed, President Trump has recently created more uncertainty by widening his ‘hit-list’ to include Vietnam: “A lot of companies are moving to Vietnam, but Vietnam takes advantage of us even worse than China… Vietnam is the single worst abuser of everybody.” This comment was followed by the imposition of ~400% US duties on some steel re-exports from Vietnam in early July.34
The US is a significant trade partner for Vietnam, accounting for ~20% of Vietnamese exports.35 Vietnam’s 2018 goods trade surplus with the US was US ~$40bn (in fifth place globally, after China, Mexico, Japan and Germany). It would thus be unwise to assume plain sailing for Vietnam now that the country is in President Trump’s crosshairs. Further US tariffs on Vietnam would no doubt impact Vietnamese stock prices in the near-term. Nevertheless, there are good geopolitical reasons for the US to maintain a close relationship with Southeast Asia’s fastest growing economy.36
Changes in technology, in particular automation and robotics, have also raised interesting questions as to whether the new ‘export tigers’ will be able to gain the same broad-based economic advantages as their forebears did by employing cheap labour resources. Another related risk is that advanced technology will help accelerate the ‘onshoring’ trend, bringing manufacturing back to the rich countries and thus depriving developing nations of the export-growth route to prosperity.
While these trends are gaining momentum, they do not yet appear to be anywhere near the magnitude that would pose a threat to the current ‘export tigers’. We do not discount the possibility, however, that such concerns will become more important in the future. If so, might that mean that the current batch of ‘export tiger cubs’ are among the last to ride the export road to riches? Perhaps.
Meanwhile, in the near-term we are doubtful that anything less than a global breakdown in trade relations will dislodge Vietnam and the other cubs from their current trajectory.
So, are Exports the ‘Only Thing’ that Matters?
This letter has talked a lot about the role of exports in driving growth and equity returns. So, is export growth the only thing that matters? Clearly, that would be an exaggeration. While exports might be the most important macro element which helps to propel developing economies towards developed country status, they are not the only thing that matters.
Another extremely important growth variable is increases in credit penetration, or ‘financial deepening’. Increases in credit directly fund new investment, and if this capital is allocated efficiently, then over time the economy will grow. Of course, in a rapidly growing ‘export tiger’ economy, rapidly rising export earnings are an important part of the fuel that helps to power increased credit growth, driving the financial deepening process and a virtuous development cycle.
It is beyond our remit (and expertise!) to initiate a detailed discussion in this letter concerning the role of credit in the economy. Suffice to note that since the fall of the Soviet Union, the adoption of property rights in (former) Communist countries, including China and Vietnam,37 has also been a very important growth driver. Property development drives GDP growth and property can be used as collateral for new loans by its owners, further hastening the financial deepening process.38

Increases in credit growth, however, can be a double-edged sword. While increased credit access for deprived consumers in poorer nations is generally seen to be a benign and even beneficial phenomenon in development terms, high debt levels – especially in advanced economies – are thought to have numerous pernicious side-effects.39 In particular, we are wary of any economy which experiences a rapid run-up in liabilities over a short period of time, as this may point to future problems including capital misallocation, funding mismatches and financial instability.
Clearly, exports are also less transformative for advanced economies. For the most part, these developed nations have already climbed the development ladder by plucking the ‘low-hanging fruit’ of export growth at some point in the past. Their export dependency has naturally declined over time as consumption has picked up the reins of growth. For such advanced economies, a much more complicated cocktail of productivity enhancements are required to drive future growth. (This topic is beyond the scope of this letter.)
Sticking with the advanced economies, we would note that it is also feasible to see strong equity returns over a sustained period even without a strong tailwind from nominal GDP and revenue growth, for instance if one or more of the other factors in the ‘equity returns matrix’ have a sufficiently powerful effect.
For instance, despite flat GDP for more than a decade, Japanese stock markets have enjoyed a gradual but sustained rise over the last five years as a result of corporate governance and improved shareholder returns.40 This has manifested itself in rising dividend distributions, reduced cross-shareholdings and more share buybacks (thereby reducing shares outstanding and boosting EPS). Stock prices have appreciated over the period, and we believe that improving corporate governance should continue to support equity returns in the coming decade.
A final word of warning: many of the factors mentioned in this missive – including export-led growth and financial deepening – are factors which exert their influence over many decades. The effect of such long-term considerations are often overwhelmed by other near-term factors such as credit growth and the capital cycle.41 These can have a large effect on current valuation multiples and next quarter’s profits, which impact this year’s returns!
In particular, valuation deserves a special mention. Vast reams of literature and investment fortunes bear witness to the importance of giving sufficient respect to valuations. Once again, we take this opportunity to reiterate that buying stocks with a sufficient margin of safety is an essential part of our investment process.42
So, Why Invest in Asia?
To those readers who have managed to stay the course, we hope you have enjoyed our tour of Asian wealth creation over the last half-century, as well as our overview of the ‘tectonic’ forces which have pushed various economies slowly but inexorably towards their respective fates.
After a lengthy detour, we thus return to our original question: why invest in Asia?
First, over the next decade and longer, selected Asian nations are still the places where investors are most likely to be able to enjoy a growth tailwind as the ‘export tiger cubs’ claw their way up the wealth creation curve.
Second, it should now be clear that our answer to ‘why Asia’ is not to ‘buy Asia’ by simply investing in an index fund. As we have seen, Asian regional indices have produced poor performance over a long period of time. At present, Vietnam seems to be the country with the best combination of growth potential and investability, yet the country is too small to be included in any major Asian equity index.
Third, Asia encompasses many countries which have already climbed the development curve and are now home to developed capital markets and numerous attractive investment opportunities.
In summary, Asia is inefficient – a fact we will return to in future letters – and it pays to be discerning on both the country and stock selection front.
It may be fascinating to ponder such fundamental questions as what makes poor countries richer, and what drive equity returns over the long run. Regular readers know, however, that this is not how we spend most of our waking and working hours.
We build our portfolio is built from the bottom-up, and we spend almost all of our time analysing individual companies and sectors. Macro analysis can help by providing more context when our bottom-up analysis suggests that we should be investing in a concentrated manner in a certain country or sector.
Vietnam is once again a case in point. We have been investing in Vietnam since 2014. Long stock positions in Vietnamese stocks have consistently accounted for around one-third of the fund. We have chosen these companies on the basis of their business models, competitive positioning, growth potential, balance sheets, valuations, and corporate governance.
Since 2014, we have worn down our shoe leather visiting company offices, touring plants and attending the AGMs of more than 100 Vietnamese firms. Quite simply, we can’t find many companies in Asia with robust business models, sustainable annual growth of >15%, strong balance sheets, good management, high dividends, and with shares that trade at double-digit cash flow yields.43
Having built our portfolio from the bottom-up, collectively our Vietnamese positions represent the fund’s largest country and currency exposure. Fortunately, our macro analysis of Vietnam suggests that export-led growth will likely continue for some time. Moreover, the consistent threats to the country’s currency which existed during the pre-2010 boom-bust era appear to have been mitigated by a large improvement in the balance of payments, and by more stable inflation dynamics.44 Such macro analysis thus gives us comfort that it is not inappropriate to maintain a large, idiosyncratic exposure to quality Vietnamese companies.
Ironically, however, Vietnam’s export success perhaps highlights the one unavoidable risk for all trade-dependent economies, which is the country’s vulnerability to a global economic downturn. This, above all else, is perhaps the most relevant risk facing Vietnam at present.
Investors should be under no illusion that when global trade retrenches and the world slips into recession, then Vietnamese stocks – just like equity markets in other countries – will be hit hard. Given the difficulty in acquiring positions in the Vietnamese stocks that we own, we do not plan to divest our core stock positions. Instead, we plan to rely on hedges to see us through any onslaught.
Thank you for reading.
Andrew Limond
The original source material has been edited for spelling, punctuation, grammar and clarity. Photographs, illustrations, diagrams and references have been updated to ensure relevance. Copies of the original quarterly letter source material are available to investors on request.
Optimism concerning Asia and Emerging Markets appears to be at low ebb.
Panah commenced in September 2013. Performance for the indices is calculated from then to end-June 2019.
World Bank database, constant 2010 USD compound annual growth to end-2018 for East Asia & Pacific (excluding high income countries).
This investment firm and the announcement quoted above are fictional. No identification with actual firms or announcements (living or deceased), people, places, buildings, and products is intended or should be inferred. Any resemblance to actual firms, living or dead, or actual announcements is purely coincidental. No animals were harmed in the making of this announcement.
Real GDP is the value of all goods and services produced by an economy, adjusted for changes in price inflation. This is in contrast to nominal GDP, which measures economic output without any inflation adjustment.
For example, see these articles from The Economist (2011) and the Financial Times (2013).
For example, see papers and books by MSCI Barra (2010), Peter Blair Henry and Prakash Kannan (2006), Jay R. Ritter (2005), and Dimson et al (2002).
High equity returns in local currency terms are also not much help if the currency is collapsing.
The link between nominal GDP and corporate revenues for listed companies can sometimes be tenuous, for instance if the companies trading on the domestic stock exchange are unrepresentative of the broader economy.
This raises the question why so many sell-side strategists burn so much energy trying to forecast year-end index targets.
The analysis in this section of the letter owes a debt of gratitude for data and original analysis to Jonathan Anderson of Emerging Advisors Group, who has championed the ‘export approach’ to understanding growth.
The World Bank database is the source for all country data except Taiwan (which is not available from the World Bank). Instead, Taiwanese figures are sourced from the National Statistics Republic of Taiwan database. The 1960 data point is plotted on the x-axis, and 2016 is on the y-axis; note the log scale. The calculations have been performed on a per capita basis in order to exclude the impact of population growth on wealth creation. For the handful of countries which have grown rapidly in recent decades but where 1960 data is not available, we have plotted the relative improvement from a later year, as specified by any additional two digits in parentheses following the relevant two-letter country code, i.e., GQ (‘62), OM (‘65), ID (‘67), VN (‘85).
Note that Ireland’s growth in recent years has also been heavily distorted by foreign multinational activity.
Of course, not all economists believe that the untrammelled export of resources is an effective way to create wealth. For instance, Export Dependency Theory (originating with Hans Singer and Raul Prebisch in 1949) states that the continuous export of primary products and import of finished goods can delay economic development and keep a country at a low level of development. Other economists such as W. Max Corden and J. Peter Neary have flagged the experience of the Netherlands in the 1960s (i.e., Dutch Disease). For those with an interest in modern critiques of more orthodox trade and development theories, we also highly recommend ‘How Rich Countries Got Rich… and Why Poor Countries Stay Poor’ (2005) by Erik S. Reinert.
Whether this is possible is another matter, as new ‘export tigers’ and entrepôts tend to emerge near existing supply chains (i.e., near existing export manufacturing nations and their heavily consuming customers).
We have used compound growth data for exports and nominal GDP (all in USD terms) from the World Bank for 1960-2016. This time period gives a satisfactory trade-off between adequate data history and availability.
The improved showing for Indonesia and Botswana in Figure 4 relative to Figure 3 can be explained by rapid population growth in both countries (as Figure 3 uses per capita data).
Capital-intensive heavy industry and knowledge-intensive high-tech production tend to come later.
Note that democracy is not required for a nation to build itself into an export manufacturing powerhouse. In fact, most of the Asian countries which have managed to build wealth over the last ~50 years through export-driven growth were controlled by authoritarian governments at the moments when key policies were adopted. This includes Korea and Taiwan (both of which only transitioned to democracy from 1987), China and more recently Vietnam (both run by authoritarian ‘Communist’ regimes), and arguably also Japan (a single-party democratic state which came under strong US influence in the early post-WW2 years). Indeed, given the difficult decisions and long-term time horizon required to become a strong export nation – involving mass population mobilisation and significant sacrifices by the workers involved – some might argue that democracies are at a disadvantage when it comes to adopting the challenging policies required to become a major export manufacturing nation. For a successful ‘export tiger’, the journey towards democracy (if it happens), typically only starts after the middle class accumulates more wealth and starts to demand more political representation. Interestingly, rising affluence in China has not (yet) led to demands for greater democratic representation from the middle class.
GDP = Consumption, Investment, Government Spending + Net Exports (i.e., Y = C + I + G + [X – M]).
Please note that we are not referring to industrialisation through import substitution (i.e., a policy to replace foreign imports with domestic production). Import substitution does not work in the same way, probably because increased savings from export earnings and rising productivity from technology transfer are not present.
Note that ‘export tiger’ nations often seek to intervene and slow their rate of currency appreciation against trading partners in order to maintain export competitiveness, e.g., China 2002-12, Vietnam 2012-now. (One side effect of this intervention is often a substantial rise in forex reserves.) It is precisely this practice of currency intervention to sustain export growth which President Trump finds so objectionable, although many would argue that this arrangement has historically created substantial benefits for both the US and its trading partners, who provide cheap goods for US consumers and also recycle their savings into the US bond market, keeping yields low.
Pakistan has a weak export base, with an export-to-GDP ratio of just 8% compared to Vietnam at >100% (Figure 8). Several years of loose fiscal and monetary policy contributed to a rapid acceleration in import growth to as high as >30% y-o-y in mid-2017, which contributed to a blow-out in the trade deficit. The currency has lost one-third of its value in the last 18 months, despite the central bank’s attempt to stabilize the PKR by doubling the policy rate since September 2017 (to a current level of 13.75%). High rates have, however, starting to impact proxy measures of consumption and imports, as well as asset markets. While a recent IMF loan might help in the near-term, the adjustment process likely has further to go before external imbalances are corrected.
A story told in the two volumes of ‘The Road to Reform’ (1991-1997 and 1998-2003). More than any other one individual, Zhu Rongji was responsible for the policies which set the stage for the rise of China in the 2000s.
The charts above use fundamental and price data for the Hang Seng China Enterprise Index (‘HSCEI’), as this represents the most easily investible index for foreign investors during the period. However, the pattern also broadly holds for the relevant onshore indices (the Shanghai and Shenzhen Composite Indices).
The first round of massive export dependency increases for South Korea and Taiwan, the ‘economic miracle’, played out from the late-1960s to the late-1980s (from ~5% to 35% in Korea and from ~20% to ~55% in Taiwan). Unfortunately, we have been unable to locate revenue and earnings data for either stock market that goes back this far, and we ask any readers who have access to this data to get in touch!
For more information on the investment case for Vietnam, see the Panah letters to investors for Q2 2015, Q2 2016 and Q1 2018, as well as the following Seraya Insights: ‘Vietnam: from Frontier to Emerging Market?’, ‘The Investment Case for Vietnam’, ‘Vietnam Has Outperformed – What Now?’.
Economists such as Michael E. Porter have claimed that geographic clusters of interconnected companies interact to reduce inefficiencies, decrease costs, and improve economies of scale.
Partly by design, as China wants to move towards more high-tech manufacturing (i.e., semiconductors).
Thailand and Malaysia also have a solid export base, though Malaysian exports have flatlined for a decade in real USD terms.
In Vietnam there are another similar number of companies listed on the UPCOM market, although we have excluded this ‘OTC market’ from consideration. Despite relative ease of access compared to Bangladesh and Cambodia, Vietnam still faces challenges such as separate onshore trading accounts and restrictive Foreign Ownership Limits.
For those with interest, these stocks can be found on the website of the Cambodia Securities Exchange.
As broadcast on a recent Fox News interview (26 June) and reported by Bloomberg News (3 July).
For a graphical breakdown, see the Observatory Project.
This article summarises some of the issues. Note that Vietnam has been making attempts to redress the trade balance, for example by buying more Boeing planes (although Boeing’s recent woes will likely delay delivery).
The relevant legislation in China was the fourth amendment to the constitution in 2004 and the Property Law of 2007. In Vietnam, land-use rights came with the Land Law of 1993.
As noted by Emerging Advisors Group, the work of development economist Hernando de Soto is also relevant in this context. In his masterpiece ‘The Mystery of Capital’ (2000), de Soto argues that ‘dead capital’ can be brought to life by introducing property rights, which allow financially disenfranchised individuals to use real estate as collateral to borrow and invest. (Fortunately, this was one of the few English-language books available in my local Tokyo library in the early-2000s, just after I moved to Japan.)
An increasing number of economists and studies have touched on the issue of high debt levels.
For more information on Japanese corporate governance, see the Panah letter to investors for Q2 2018 and the following Seraya Insight: ‘Shareholder Engagement & Activism in Asia’.
For more information on the impact of the capital cycle, see the Panah letter to investors for Q1 2019 and the following Seraya Insight: ‘“Capital Cycle” Investing: The Market-Cycle Diaries’.
For more information on our approach to valuation, see the Panah Fund letter to investors for Q3 2017 and the following Seraya Insight: ‘The Trials & Temptations of a Value Investor’.
For a review of Panah’s largest holding in a Vietnamese IT-telecom conglomerate, see the Panah Fund letter to investors for Q3 2018 and the following Seraya Insight: ‘“Compounders”: The Ultimate 'Lazy' Investment Choice?’.
For more information on why we think the Vietnamese Dong should enjoy more stability from now compared to last decade, see the Panah letter to investors for Q2 2016 and the following Seraya Insight: ‘The Investment Case for Vietnam’; our analysis from that time remains broadly valid.


